 Back
BackIntroduction to the Cartesian Coordinate System and Plotting Points
Study Guide - Smart Notes
 Tailored notes based on your materials, expanded with key definitions, examples, and context.
Graphing Equations and Inequalities
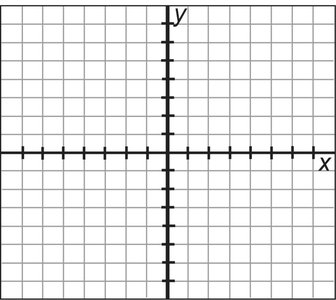
The Cartesian Coordinate System
The Cartesian coordinate system is a two-dimensional plane defined by a horizontal axis (x-axis) and a vertical axis (y-axis). This system is fundamental in algebra for graphing equations, inequalities, and points.
x-axis: The horizontal number line in the plane.
y-axis: The vertical number line in the plane.
Origin: The point where the x-axis and y-axis intersect, denoted as (0, 0).
Quadrants: The axes divide the plane into four regions called quadrants.
Plotting Points on the Coordinate Plane
Each point in the plane is identified by an ordered pair (x, y), where x is the horizontal position and y is the vertical position. To plot a point:
Start at the origin (0, 0).
Move x units left (if x is negative) or right (if x is positive).
From there, move y units down (if y is negative) or up (if y is positive).
Example: The point (3, 2) is 3 units to the right and 2 units up from the origin.
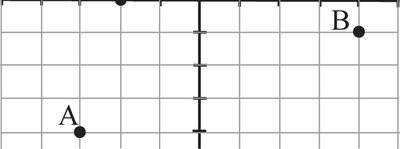
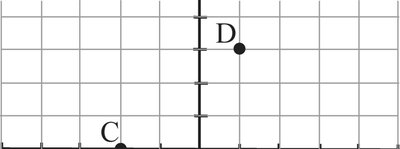
Examples of Points on the Coordinate Plane
The following images show examples of points labeled on the coordinate plane:
Points A and B: These points are plotted in different quadrants, demonstrating how to locate points with both positive and negative coordinates.
Points C and D: These points further illustrate plotting in the coordinate plane, with one point possibly in the lower left and another in the upper right.
Blank Grids for Practice
Blank coordinate grids are often used for practice in plotting points, graphing lines, and visualizing equations. These grids help students become familiar with the structure of the coordinate plane and the process of graphing.
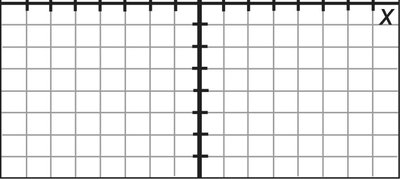
Additional info: The repetition of blank grids with labeled axes suggests these are intended for student practice in plotting points or graphing equations, which is a foundational skill in beginning algebra.
