 Back
BackEcology: Population and Community Dynamics – Study Notes
Study Guide - Smart Notes
 Tailored notes based on your materials, expanded with key definitions, examples, and context.
Ecology Basics
Introduction to Ecology
Ecology is the scientific study of interactions between organisms and their environment, encompassing both abiotic (non-living) and biotic (living) factors. Ecologists analyze how these interactions influence the distribution and abundance of organisms across various levels of biological organization.
Abiotic factors: Non-living environmental components such as temperature, light, water, nutrients, soil, and wind.
Biotic factors: Living components including bacteria, protists, fungi, plants, animals, and interactions like competition and symbiosis.
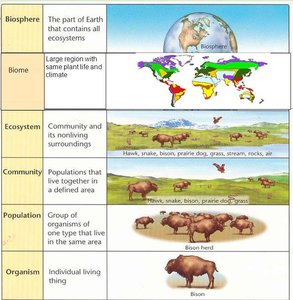
Ecology is studied at five hierarchical levels:
Organism: Adaptations of individual organisms to their environment.
Population: Groups of individuals of the same species in a given area.
Community: Interactions among different populations in a shared environment.
Ecosystem: Interactions between communities and their abiotic environment, focusing on energy flow and nutrient cycling.
Biosphere: Global interactions among ecosystems affecting the entire Earth.
Population Ecology
Population Size and Density
A population consists of all individuals of the same species living in a specific area at the same time. Demography is the statistical study of populations, focusing on changes in size and structure over time. Key measures include:
Population size (N): Total number of individuals.
Population density: Number of individuals per unit area or volume.
Measuring Population Size
Direct counting is often impractical, so ecologists use sampling methods:
Quadrat Method: Used for immobile or slow-moving organisms. Counts in small plots are extrapolated to estimate total population.
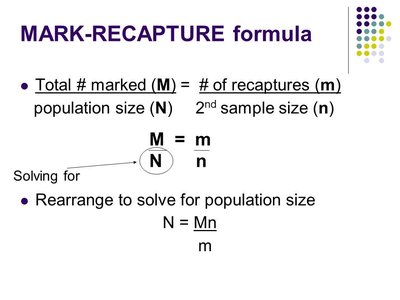
Mark-Recapture Method: Used for mobile organisms. Involves marking a sample, releasing them, and later recapturing a second sample to estimate population size using the formula:
M: Number marked in first sample
n: Total in second sample
m: Number of marked recaptures
Patterns of Dispersion
Dispersion patterns describe how individuals are distributed in space:
Clumped: Individuals aggregate in patches (e.g., herds, seed dispersal near parent plants).
Uniform: Even spacing, often due to territoriality.
Random: Unpredictable spacing, often seen in wind-dispersed plants.

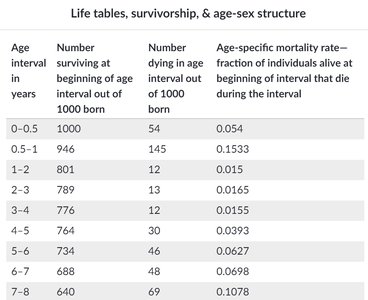
Life Tables and Survivorship Curves
Life tables summarize birth and death rates at different life stages, helping predict population trends. Survivorship curves graphically represent the proportion of individuals surviving at each age:
Type I: High survival early, steep decline at old age (e.g., humans, large mammals).
Type II: Constant mortality rate (e.g., birds, some reptiles).
Type III: High mortality early, survivors live long (e.g., fish, insects).
Age interval (years) | Number surviving at beginning | Number dying in interval | Age-specific mortality rate |
|---|---|---|---|
0–0.5 | 1000 | 54 | 0.054 |
0.5–1 | 946 | 145 | 0.1533 |
1–2 | 801 | 12 | 0.015 |
2–3 | 789 | 13 | 0.0165 |
3–4 | 776 | 12 | 0.0155 |
4–5 | 764 | 30 | 0.0393 |
5–6 | 734 | 46 | 0.0627 |
6–7 | 688 | 48 | 0.0698 |
7–8 | 640 | 69 | 0.1078 |
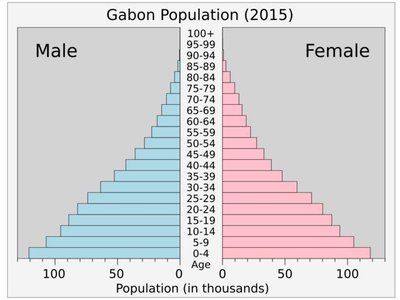
Age-Sex Structures
Age-sex pyramids display the distribution of a population by age and gender, providing insights into growth trends and demographic transitions.

Life History Strategies: r- and K-selection
Life history strategies describe patterns of growth, reproduction, and survival shaped by natural selection:
r-selection: High reproductive rate, low parental investment, high mortality (e.g., insects, fish).
K-selection: Low reproductive rate, high parental investment, low mortality (e.g., mammals, birds).
Trait | r Selection | K Selection |
|---|---|---|
Age of maturation | Young | Older |
Number of offspring | Many | Few |
Frequency of breeding | Frequent | Infrequent |
Size of offspring | Small | Larger |
Mortality rates | High | Low |
Examples | Mice, insects | Whales, humans |

Population Dynamics and Growth Models
Population dynamics studies changes in population size and composition over time. Two primary mathematical models describe population growth:
Exponential Growth: Occurs when resources are unlimited. Population grows at a constant rate, producing a J-shaped curve.
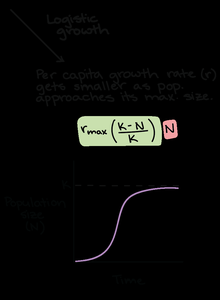
Logistic Growth: Occurs when resources are limited. Growth slows as population approaches carrying capacity (K), producing an S-shaped curve.
Regulation of Population Size
Population size is regulated by limiting factors:
Density-dependent factors: Effects increase with population density (e.g., competition, predation, disease).
Density-independent factors: Effects are unrelated to population density (e.g., natural disasters, climate).
Community Ecology
Interspecific Interactions
Species interact in various ways, influencing community structure and population dynamics:
Interaction | Effect on Species 1 | Effect on Species 2 | Description |
|---|---|---|---|
Competition | - | - | Both species are harmed |
Predation | + | - | One benefits, one is harmed |
Mutualism | + | + | Both benefit |
Commensalism | + | 0 | One benefits, other unaffected |
Resource Partitioning
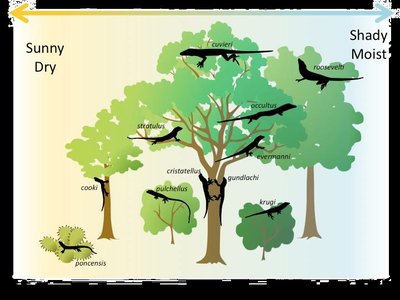
Resource partitioning allows similar species to coexist by utilizing different resources or occupying different niches, reducing direct competition.

Community Structure and Diversity
Community structure is described by species richness (number of species) and species diversity (richness and relative abundance). High diversity often confers greater stability and resilience to disturbance.

Simpson’s Diversity Index
Simpson’s Diversity Index quantifies biodiversity by considering both species richness and evenness:
n: Number of individuals of a particular species
N: Total number of individuals of all species
Summary Table: Key Concepts in Population and Community Ecology
Concept | Definition | Example/Application |
|---|---|---|
Population | Group of same species in an area | Bison herd |
Community | All populations in an area | Prairie ecosystem |
Ecosystem | Community + abiotic factors | Grassland with soil, water, air |
Biosphere | All ecosystems on Earth | Global scale |
Additional info: These notes provide foundational concepts in ecology, focusing on population and community dynamics, which are essential for understanding broader biological and environmental processes.
