 Back
BackStep-by-Step Guidance for Biochemistry Enzyme Kinetics, DNA, and Glycan Questions
Study Guide - Smart Notes
 Tailored notes based on your materials, expanded with key definitions, examples, and context.
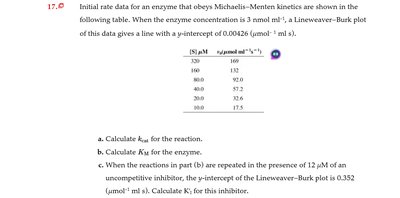
Q17.0: Initial rate data for an enzyme that obeys Michaelis–Menten kinetics
Background
Topic: Enzyme Kinetics (Michaelis–Menten, Lineweaver–Burk, Inhibition)
This question tests your understanding of enzyme kinetics, specifically how to determine , , and using Michaelis–Menten and Lineweaver–Burk plots, including the effect of inhibitors.
Key Terms and Formulas:
: Turnover number, calculated as
: Michaelis constant, reflects substrate affinity
Lineweaver–Burk equation:
Uncompetitive inhibition: can be calculated from changes in y-intercept
Step-by-Step Guidance
Review the provided substrate concentrations and initial rates. Understand how these relate to Michaelis–Menten kinetics.
Recall that the y-intercept of a Lineweaver–Burk plot () allows you to calculate .
Use the enzyme concentration and calculated to set up the formula for : .
For , use the slope of the Lineweaver–Burk plot () and your calculated to set up the formula for .
For the inhibitor, note the change in y-intercept and use the relationship for uncompetitive inhibition to set up the formula for .
Try solving on your own before revealing the answer!
Final Answer:
See calculations for , , and using the provided data and formulas. is calculated from and enzyme concentration, from the slope, and from the change in y-intercept with inhibitor.
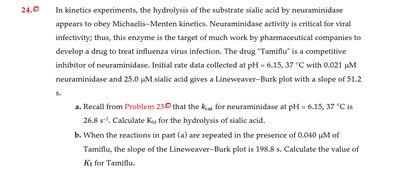
Q24.0: Kinetics experiments with neuraminidase and competitive inhibition by Tamiflu
Background
Topic: Enzyme Kinetics, Competitive Inhibition
This question tests your ability to calculate and for an enzyme reaction, using Lineweaver–Burk plot slopes and the effect of a competitive inhibitor.
Key Terms and Formulas:
: Michaelis constant
Competitive inhibition: calculated from change in slope
Lineweaver–Burk slope:
In presence of inhibitor:
Step-by-Step Guidance
Recall the value from the previous problem and use it to relate to .
Use the slope of the Lineweaver–Burk plot to set up the formula for .
For the inhibitor, compare the slopes with and without inhibitor to set up the formula for .
Plug in the values for inhibitor concentration and slopes to solve for .
Try solving on your own before revealing the answer!
Final Answer:
Calculate from the slope and from the change in slope with Tamiflu using the competitive inhibition formula.
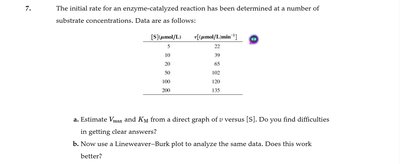
Q7.0: Initial rate for an enzyme-catalyzed reaction at various substrate concentrations
Background
Topic: Enzyme Kinetics, Michaelis–Menten, Lineweaver–Burk
This question tests your ability to estimate and from direct and Lineweaver–Burk plots.
Key Terms and Formulas:
: Maximum velocity
: Michaelis constant
Michaelis–Menten equation:
Lineweaver–Burk equation:
Step-by-Step Guidance
Plot versus to visually estimate and .
Discuss potential difficulties in estimating these values directly from the graph.
Set up the Lineweaver–Burk plot by calculating and for each data point.
Use the Lineweaver–Burk plot to determine and from the y-intercept and slope.
Try solving on your own before revealing the answer!
Final Answer:
Estimate and from both direct and Lineweaver–Burk plots, noting which method gives clearer results.
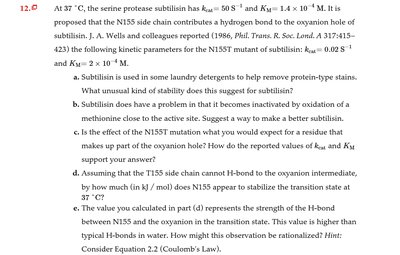
Q12.0: Subtilisin kinetics and effects of mutations
Background
Topic: Enzyme Kinetics, Protein Stability, Mutagenesis
This question explores enzyme kinetics, protein stability, and the effects of mutations on and .
Key Terms and Formulas:
: Turnover number
: Michaelis constant
Protein stability: Resistance to denaturation or inactivation
Mutagenesis: Changing amino acids to affect enzyme function
Step-by-Step Guidance
Analyze the role of subtilisin in protein stain removal and relate to enzyme stability.
Discuss the problem of inactivation by oxidation and propose solutions.
Consider the effect of the N155T mutation and how it would affect the active site and kinetics.
Use the provided and values to compare wild-type and mutant subtilisin.
Set up the calculation for H-bond strength using Coulomb's Law as hinted.
Try solving on your own before revealing the answer!
Final Answer:
Compare and for wild-type and mutant, and rationalize the H-bond strength using Coulomb's Law.
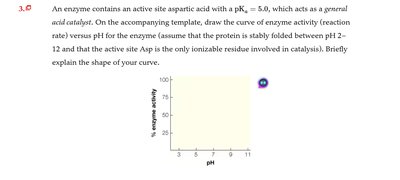
Q3.0: Enzyme activity versus pH for an active site aspartic acid
Background
Topic: Enzyme Catalysis, pH Dependence
This question tests your understanding of how pH affects enzyme activity, especially when the active site contains an ionizable residue.
Key Terms and Formulas:
: The pH at which half the residue is protonated
General acid catalysis: Activity depends on protonation state
Step-by-Step Guidance
Draw the curve of enzyme activity versus pH, noting the of the active site residue.
Explain why activity is highest near the and drops at extreme pH values.
Discuss the effect of protein stability across the pH range.
Try solving on your own before revealing the answer!
Final Answer:
The curve peaks near and drops at lower and higher pH due to changes in protonation state and protein stability.
Q6.0: Enzyme binding to substrate versus transition state
Background
Topic: Enzyme Catalysis, Transition State Theory
This question tests your understanding of how enzyme binding affects reaction rate and whether tight binding to substrate or transition state is more effective for catalysis.
Key Terms and Formulas:
Transition state stabilization: Key to catalytic rate enhancement
Substrate binding: Not sufficient for catalysis if not transition state-specific
Step-by-Step Guidance
Discuss the difference between binding substrate and binding transition state.
Explain why transition state stabilization is critical for catalysis.
Analyze whether tight substrate binding would enhance rate or not.
Try solving on your own before revealing the answer!
Final Answer:
Only transition state binding enhances catalysis; tight substrate binding may inhibit reaction by stabilizing the substrate.
Q23.0: Blood transfusion compatibility for type AB blood
Background
Topic: Blood Types, Immunology
This question tests your understanding of blood group antigens and transfusion compatibility.
Key Terms and Formulas:
AB blood type: Universal recipient
Antigen-antibody compatibility
Step-by-Step Guidance
Review the antigens present on AB blood cells and antibodies in plasma.
Explain why AB individuals can receive from any blood type but only donate to AB.
Try solving on your own before revealing the answer!
Final Answer:
AB blood has both A and B antigens, so no antibodies against A or B; can receive from any type but only donate to AB.
Q14.0: Glycosidic bond diversity and trisaccharide formation
Background
Topic: Glycans, Glycosidic Bonds, Oligosaccharide Diversity
This question tests your understanding of peptide and glycan diversity, and how glycosidic bonds increase information content.
Key Terms and Formulas:
Tripeptide: Sequence of three amino acids
Trisaccharide: Sequence of three sugars
Glycosidic bond: Linkage between sugars
Step-by-Step Guidance
Calculate the number of possible tripeptides from three amino acids.
Calculate the number of possible trisaccharides from three sugars, considering bond diversity.
Use shorthand notation to list possible trisaccharides.
Try solving on your own before revealing the answer!
Final Answer:
Tripeptide diversity is limited by sequence; trisaccharide diversity is much greater due to glycosidic bond variation.
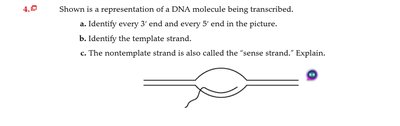
Q4.0: DNA transcription representation
Background
Topic: DNA Transcription, Strand Identification
This question tests your ability to identify DNA strand ends, template strand, and sense strand in transcription.
Key Terms and Formulas:
3' and 5' ends: Directionality of DNA
Template strand: Used for RNA synthesis
Sense strand: Non-template, same sequence as RNA (except T/U)
Step-by-Step Guidance
Identify the 3' and 5' ends in the diagram.
Determine which strand is the template based on transcription direction.
Explain why the non-template strand is called the sense strand.
Try solving on your own before revealing the answer!
Final Answer:
Template strand is used for RNA synthesis; sense strand matches RNA sequence.
Q13.0: Lineweaver–Burk plots and enzyme inhibition types
Background
Topic: Enzyme Kinetics, Inhibition Types
This question tests your ability to interpret Lineweaver–Burk plots and identify inhibition types.
Key Terms and Formulas:
Competitive, uncompetitive, mixed inhibition
Lineweaver–Burk plot: Changes in slope and y-intercept indicate inhibition type
Step-by-Step Guidance
Analyze each plot for changes in slope and y-intercept.
Identify which plot corresponds to which inhibition type.
Assign lines to reactions with and without inhibitor.
Try solving on your own before revealing the answer!
Final Answer:
Competitive: slope increases, y-intercept same; uncompetitive: y-intercept increases; mixed: both change.
Q3.0: DNA and RNA sequence structure
Background
Topic: Nucleic Acid Structure, DNA/RNA Sequence Representation
This question tests your ability to write DNA and RNA sequences using conventions and identify the non-template strand.
Key Terms and Formulas:
DNA strand: Sequence written 5' to 3'
Non-template strand: Matches RNA sequence (except T/U)
Step-by-Step Guidance
Use the straight-chain sugar convention to write the DNA strand encoding the RNA.
Write the non-template DNA strand using base sequence conventions.
Try solving on your own before revealing the answer!
Final Answer:
DNA strand encodes RNA; non-template strand matches RNA sequence (with T instead of U).
Q14.0: Enzyme kinetics with inhibitor A
Background
Topic: Enzyme Kinetics, Inhibition Types
This question tests your ability to analyze enzyme kinetics data in the presence and absence of an inhibitor, and determine and .
Key Terms and Formulas:
Competitive, uncompetitive, mixed inhibition
and determination from data
Step-by-Step Guidance
Compare initial rates with and without inhibitor at each substrate concentration.
Analyze how and change in presence of inhibitor.
Determine inhibition type based on changes in kinetic parameters.
Try solving on your own before revealing the answer!
Final Answer:
Determine and from data; inhibition type based on parameter changes.
Q20.0: Site-directed mutagenesis to change His codon to Pro codon
Background
Topic: Molecular Biology, Site-Directed Mutagenesis
This question tests your ability to design an oligonucleotide for site-directed mutagenesis to change a codon in a gene.
Key Terms and Formulas:
Oligonucleotide: Short DNA sequence used for mutagenesis
Codon change: Targeted mutation in gene sequence
Step-by-Step Guidance
Identify the target codon and surrounding sequence.
Design an oligonucleotide that introduces the desired mutation.
Ensure the oligonucleotide is complementary to the target region.
Try solving on your own before revealing the answer!
Final Answer:
Oligonucleotide sequence includes the mutated codon and flanking regions for site-directed mutagenesis.
Q1.0: Identify nucleobases, nucleosides, and nucleotides
Background
Topic: Nucleic Acid Chemistry
This question tests your ability to distinguish between nucleobases, nucleosides, and nucleotides.
Key Terms and Formulas:
Nucleobase: Nitrogenous base
Nucleoside: Base + sugar
Nucleotide: Base + sugar + phosphate
Step-by-Step Guidance
Identify each substance as nucleobase, nucleoside, or nucleotide based on its name.
Use the suffixes and prefixes to distinguish types.
Try solving on your own before revealing the answer!
Final Answer:
Fill in the blanks with the correct identification for each substance.
Q17.0: DNA renaturation curve phases
Background
Topic: DNA Renaturation, Molecular Biology
This question tests your understanding of DNA renaturation phases and how sequence complexity affects renaturation rate.
Key Terms and Formulas:
Renaturation: Re-annealing of DNA strands
C0t curve: Initial concentration × time
Sequence complexity: Unique, moderately repetitive, highly repetitive
Step-by-Step Guidance
Identify each phase of the curve and relate to sequence type.
Sketch expected curve for single-copy gene.
Discuss effect of cDNA versus genomic DNA on renaturation rate.
Try solving on your own before revealing the answer!
Final Answer:
Phases correspond to unique, moderately repetitive, and highly repetitive sequences; cDNA renatures differently than genomic DNA.
Q6.0: Human chromosome mass, length, and compaction
Background
Topic: DNA Structure, Chromosome Compaction
This question tests your ability to calculate chromosome mass, length, and compaction ratio.
Key Terms and Formulas:
Base pair mass: 660 daltons
Chromosome length: Number of base pairs × length per base pair
Compaction ratio: Extended length / actual length
Step-by-Step Guidance
Calculate chromosome mass using base pair mass and protein content.
Calculate extended length using number of base pairs.
Determine compaction ratio using actual and extended lengths.
Calculate total DNA length in all cells.
Try solving on your own before revealing the answer!
Final Answer:
Chromosome mass, length, and compaction ratio calculated from provided data.
Q7.0: Nucleosome compaction ratio in chromatin
Background
Topic: Chromatin Structure, DNA Compaction
This question tests your understanding of nucleosome packing and compaction ratio in chromatin.
Key Terms and Formulas:
Nucleosome: DNA wrapped around histone proteins
Compaction ratio: Extended length / packed length
Step-by-Step Guidance
Calculate compaction ratio based on nucleosome density.
Compare with previous compaction ratio calculation.
Try solving on your own before revealing the answer!
Final Answer:
Compaction ratio calculated from nucleosome density; compare with previous answer.
