A population is a group of individuals of a single species living in the same general area, experiencing the same environment, capable of interbreeding, and often defined by boundaries.
What are the 3Ds of population ecology?
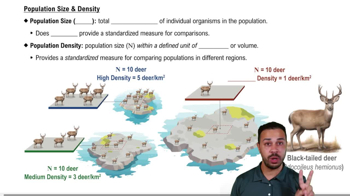
Density (number of individuals per unit area/volume), Dispersion (pattern of spacing among individuals), and Demographics (how population characteristics change over time).
How is population density measured?
Density can be measured by direct counts, sampling and extrapolation, mark-recapture methods, or counting indicators like nests, burrows, tracks, or feces.
What assumptions are made in mark-recapture studies?
Marked and unmarked animals have the same capture likelihood, marked animals remix into the population, and no births, deaths, immigration, or emigration occur between samplings.
What are the three main dispersion patterns in populations?
Clumped (aggregated in patches), Uniform (evenly spaced, often due to competition), and Random (independent positions, usually when resources are evenly distributed).
Why do populations show clumped dispersion?
Individuals aggregate in areas with high resources or favorable conditions such as water, food, mates, or predator avoidance.
What causes uniform dispersion in populations?
Uniform spacing often results from antagonistic interactions like territoriality or allelopathy (chemical competition).
What does random dispersion indicate about resource distribution?
Random dispersion suggests resources and conditions are evenly distributed or equally good for survival.
What information does a life table provide in population ecology?
A life table summarizes age-specific survival and reproduction data, often following a cohort from birth to death.
What are survivorship curves and their types?
Survivorship curves plot the percentage of a cohort alive at each age. Types: I (low death rate early, high late), II (constant death rate), III (high early death rate).
What factors influence reproductive rate in populations?
Age, frequency of reproduction, access to mates, clutch size, and parental care all influence reproductive rate.
What is the exponential growth model in population ecology?
It describes population growth under ideal, unlimited conditions with \(\frac{dN}{dt} = rN\), where r is per capita growth rate.
What shape does exponential population growth produce on a graph?
Exponential growth produces a J-shaped curve when population size is plotted over time.
What is carrying capacity (K)?
Carrying capacity is the maximum population size an environment can support based on limiting resources like food, water, shelter, and nutrients.
How does carrying capacity affect population growth rate (r)?
As population nears carrying capacity, resource limitation causes per capita birth rates to decline and death rates to increase, reducing r.
What is the logistic growth model formula?
Logistic growth is modeled as \(\frac{dN}{dt} = rN \left(\frac{K-N}{K}\right)\), where growth slows as population approaches K.
What are life history traits?
Life history traits include age at first reproduction, frequency of reproduction (semelparity vs iteroparity), and number of offspring per reproductive event.
What factors cause changes in population growth rates?
Direct causes: birth rate, death rate, immigration, emigration. Indirect causes: biotic factors (competition, disease), abiotic factors (resource availability, climate).
How do predator-prey interactions affect population dynamics?
Predator-prey cycles can cause population fluctuations; for example, snowshoe hare populations cycle due to predator pressure rather than food supply alone.
Why is exponential growth often unrealistic in natural populations?
Because resources are limited and environmental conditions vary, populations usually experience slowed growth near carrying capacity, not unlimited exponential growth.
 Back
Back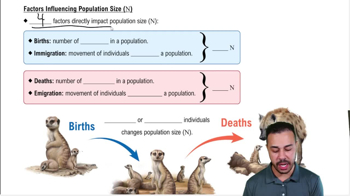
 01:48
01:48