 Back
BackAnalyzing Local Extrema from a Graph
Study Guide - Smart Notes
 Tailored notes based on your materials, expanded with key definitions, examples, and context.
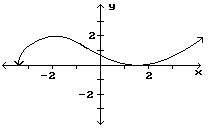
Q14. Find the location and value of each local extremum for the function shown in the graph below.
Background
Topic: Local Extrema (Maximum and Minimum Points)
This question tests your ability to identify local maxima and minima (collectively called local extrema) by analyzing the graph of a function. Local extrema are points where the function changes direction from increasing to decreasing (maximum) or from decreasing to increasing (minimum).
Key Terms and Concepts:
Local Maximum: A point where the function value is higher than all nearby points.
Local Minimum: A point where the function value is lower than all nearby points.
Critical Point: A point where the derivative is zero or undefined, and where local extrema may occur.
Step-by-Step Guidance
Examine the graph and identify all points where the function changes from increasing to decreasing (these are candidates for local maxima) and from decreasing to increasing (candidates for local minima).
Look for the peaks (highest points in a neighborhood) and valleys (lowest points in a neighborhood) on the graph. These are typically where the tangent line is horizontal (slope = 0).
Label each extremum as a local maximum or minimum based on the direction of the curve at those points. For example, if the curve goes up to a point and then down, it's a maximum; if it goes down to a point and then up, it's a minimum.
Record the x-values (such as a, b, c, etc.) where these extrema occur. You do not need to find the exact y-values unless specifically asked.
Try solving on your own before revealing the answer!
Final Answer:
Local maxima occur at x = b and x = d. Local minima occur at x = c, x = f, and x = h.
These are the points where the function changes direction, as seen from the graph.
