 Back
BackApplications of Differentiation: Extrema, Concavity, Optimization, and Elasticity
Study Guide - Smart Notes
 Tailored notes based on your materials, expanded with key definitions, examples, and context.
Applications of Differentiation
Using First Derivatives: Extrema and Graph Sketching
The first derivative of a function provides critical information about the behavior of the function, including where it increases or decreases, and where it attains local maximum or minimum values. These concepts are essential for analyzing and sketching the graphs of functions in business calculus.
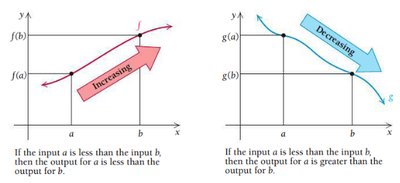
Increasing and Decreasing Functions
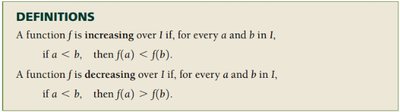
Definition: A function f is increasing on an interval if, for any a < b, f(a) < f(b). It is decreasing if f(a) > f(b).
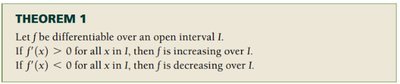
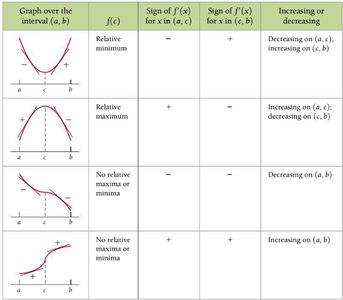
The sign of the first derivative, f'(x), determines whether a function is increasing (f'(x) > 0) or decreasing (f'(x) < 0).
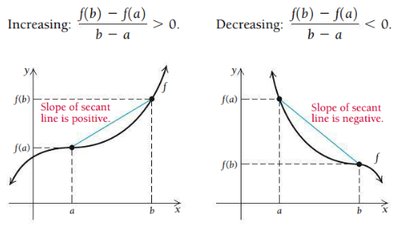
The slope of the secant or tangent line can be used to determine intervals of increase or decrease.
Critical Values and Points
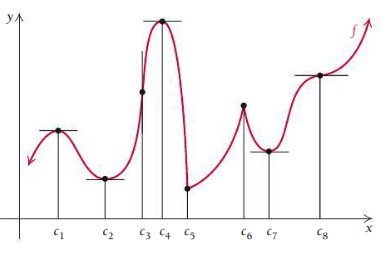
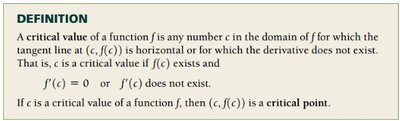
Critical Value: A number c in the domain of f where f'(c) = 0 or f'(c) does not exist.
Critical Point: The point (c, f(c)) corresponding to a critical value.
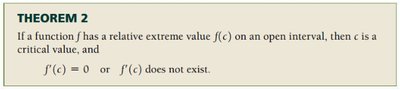
Critical points are candidates for relative extrema (maximum or minimum values).
Relative (Local) Extrema
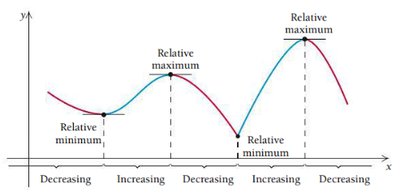
Relative Maximum: A point where f(c) is higher than all nearby points.
Relative Minimum: A point where f(c) is lower than all nearby points.
Relative extrema occur at critical points, but not all critical points are extrema.
The First-Derivative Test
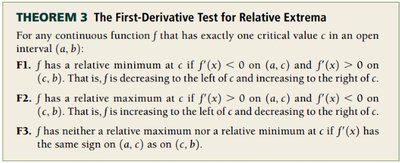
Used to classify critical points as relative maxima, minima, or neither.
If f'(x) changes from negative to positive at c, f(c) is a relative minimum.
If f'(x) changes from positive to negative at c, f(c) is a relative maximum.
If f'(x) does not change sign, f(c) is not a relative extremum.
Using Second Derivatives: Concavity and Inflection Points
The second derivative provides information about the concavity of a function and helps classify extrema further. It also identifies points of inflection, where the graph changes concavity.
Concavity
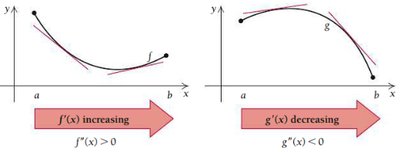
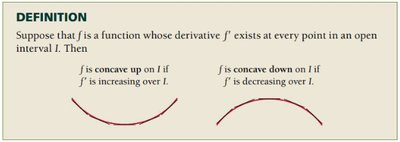
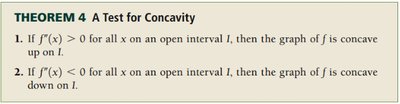
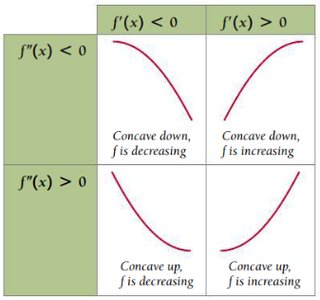
Concave Up: The graph bends upward; f''(x) > 0.
Concave Down: The graph bends downward; f''(x) < 0.
Concavity is determined by the sign of the second derivative.
Second-Derivative Test for Relative Extrema
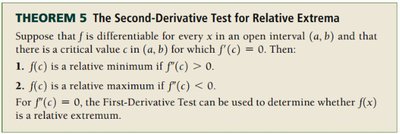
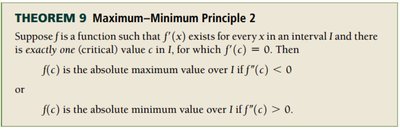
If f'(c) = 0 and f''(c) > 0, f(c) is a relative minimum.
If f'(c) = 0 and f''(c) < 0, f(c) is a relative maximum.
If f''(c) = 0, use the First-Derivative Test.
Points of Inflection
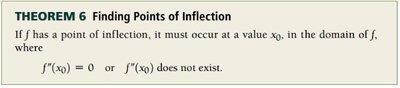
A point where the graph changes concavity (from up to down or down to up).
Occurs where f''(x) = 0 or f''(x) does not exist, and concavity changes.
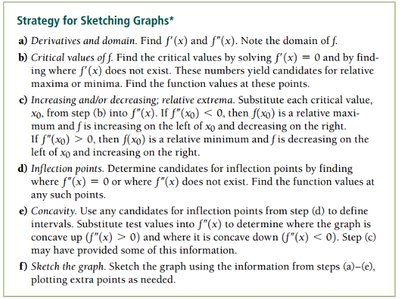
Strategy for Curve Sketching
Find derivatives and domain.
Identify critical values and endpoints.
Classify extrema using the First- or Second-Derivative Test.
Determine intervals of increase/decrease and concavity.
Locate inflection points.
Sketch the graph using all gathered information.
Optimization: Finding Absolute Extrema
Optimization involves finding the highest or lowest value (absolute maximum or minimum) of a function, often subject to constraints. This is crucial in business applications such as maximizing profit or minimizing cost.
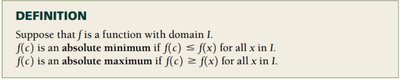
Absolute Extrema
Absolute Maximum: The highest value of f(x) over its domain.
Absolute Minimum: The lowest value of f(x) over its domain.
The Extreme-Value Theorem
A continuous function on a closed interval [a, b] has both an absolute maximum and minimum.

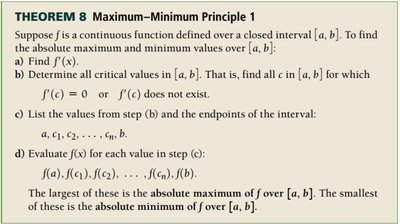
Finding Absolute Extrema: Maximum-Minimum Principles
Find f'(x) and solve for critical values in the interval.
Evaluate f(x) at critical values and endpoints.
The largest value is the absolute maximum; the smallest is the absolute minimum.
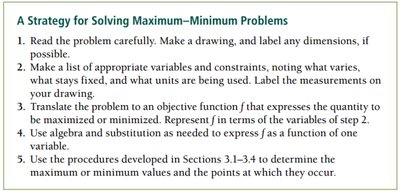
Strategy for Solving Maximum–Minimum Problems
Draw and label diagrams if possible.
List variables, constraints, and units.
Express the objective function in terms of one variable.
Use calculus to find and classify extrema.
Optimization in Business and Economics
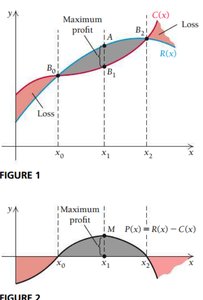
Optimization techniques are widely used in business to maximize profit, minimize cost, and allocate resources efficiently.
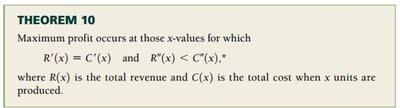
Profit Maximization
Profit is maximized where the derivative of revenue equals the derivative of cost: and .
Applications: Inventory and Revenue
Inventory costs can be minimized by optimizing order size and frequency.
Revenue is maximized by analyzing demand and price relationships.


Elasticity of Demand
Elasticity of demand measures how sensitive the quantity demanded is to changes in price. It is a key concept in economics for pricing strategies and revenue optimization.
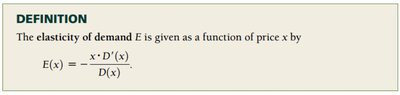
Definition of Elasticity
The elasticity of demand E(x) is given by .
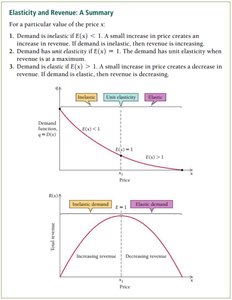
If E(x) < 1, demand is inelastic; if E(x) > 1, demand is elastic; if E(x) = 1, demand has unit elasticity (revenue is maximized).
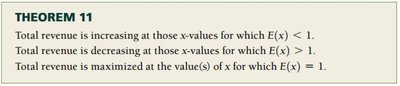
Elasticity and Revenue
Total revenue increases when demand is inelastic and decreases when demand is elastic.
Total revenue is maximized when elasticity equals 1.
Additional info: These notes synthesize the main theoretical results, definitions, and strategies for analyzing and optimizing functions using calculus, with a focus on business applications such as profit maximization, cost minimization, and elasticity of demand. The included images reinforce key concepts and provide visual summaries of theorems and strategies.
