 Back
BackApplications of Integration in Business and Economics
Study Guide - Smart Notes
 Tailored notes based on your materials, expanded with key definitions, examples, and context.
Chapter 6: Additional Integration Topics
Applications in Business and Economics
This section explores advanced applications of definite integrals in business and economics, focusing on probability, income streams, and surplus analysis. These concepts are essential for understanding how calculus is used to solve real-world business problems.
Probability Density Functions
Definition and Properties
A probability density function (pdf) is a function used to model the probability that a continuous random variable falls within a certain interval. For a function f(x) to be a valid pdf, it must satisfy:
Non-negativity: for all real
Total Area:
Probability over Interval: For any interval ,
Continuous random variables, such as IQ scores or product lifetimes, are modeled using pdfs.
The Normal Probability Density Function
The normal distribution is one of the most important probability density functions in statistics and business. Its general form is:
is the mean (average value)
is the standard deviation (spread of the distribution)
The area under the normal curve over the entire real line is exactly 1, representing total probability.
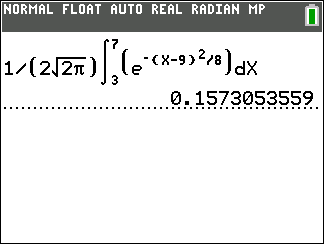
Example: LED Life Expectancies
Suppose the life expectancy of LED flood lights is normally distributed with mean years and standard deviation years. To find the probability that a randomly selected LED lasts between 3 and 7 years, evaluate:
Using a calculator, this probability is approximately 0.16 or 16%.
Continuous Income Streams
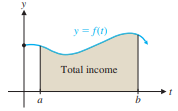
Definition and Calculation
A continuous income stream is a flow of income received at every instant over a period of time. If the rate of income at time is , the total income from to is:
This integral represents the area under the rate function over the interval .
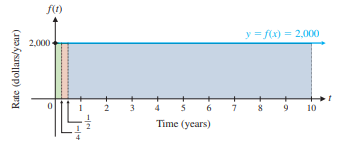
Example: Vending Machine Income
If a vending machine generates income at a rate dollars per year, the total income over the first 5 years is:
Evaluating this gives a total income of $27,675 over 5 years.
Future Value of a Continuous Income Stream
Continuous Compounding
When income is continuously invested at a constant interest rate , the future value at time is:
This formula accounts for both the income received and the interest earned on each infinitesimal deposit.
Example: Trust Fund with Continuous Investment
If per year is received continuously for 10 years and invested at 8% interest compounded continuously, the future value is:
Evaluating this gives $30,639. The interest earned is $30,639 - $20,000 = $10,639.
Example: Vending Machine Future Value
For the vending machine income stream , invested at 12% for 5 years:
The future value is $37,545, and the interest earned is $9,870.
Consumers’ Surplus
Definition and Calculation
Consumers’ surplus measures the difference between what consumers are willing to pay for a good and what they actually pay. If is the demand function and is the market price for units, then:
This is the area between the demand curve and the market price, up to the quantity sold.
Example: Linear Demand
Given and a market price of $8D(x) = 8$.
Producers’ Surplus
Definition and Calculation
Producers’ surplus is the difference between the market price and the minimum price at which producers are willing to supply each unit. If is the supply function:
This is the area above the supply curve and below the market price, up to the quantity sold.
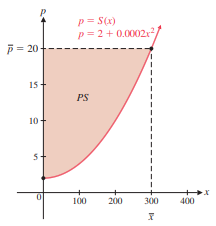
Example: Quadratic Supply
Given and a market price of $20S(x) = 20$.
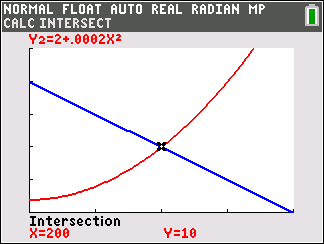
Equilibrium Price and Surplus
Finding Equilibrium
The equilibrium price occurs where supply equals demand: . Solve for to find the equilibrium quantity, then substitute back to find the equilibrium price.
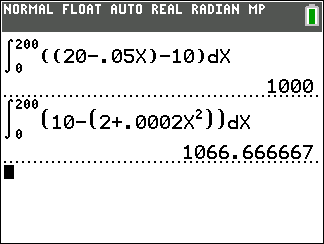
Calculating Surpluses at Equilibrium
Once equilibrium is found, consumers’ and producers’ surpluses can be calculated using the integrals above, evaluated up to the equilibrium quantity.
Additional info: These applications demonstrate how integration is used to analyze economic behavior, optimize financial outcomes, and interpret statistical data in business contexts.
