 Back
BackBusiness Calculus Final Exam Review: Step-by-Step Guidance
Study Guide - Smart Notes
 Tailored notes based on your materials, expanded with key definitions, examples, and context.
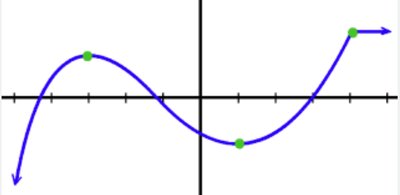
Q1. Find the equation of the secant line from the graph to the right.
Background
Topic: Secant Lines and Average Rate of Change
This question tests your understanding of how to find the equation of a secant line, which connects two points on a function's graph and represents the average rate of change between those points.
Key Terms and Formulas:
Secant Line: A line passing through two points on a curve.
Average Rate of Change:
Point-Slope Form:
Step-by-Step Guidance
Identify the two points on the graph where the secant line will pass. These are usually marked or specified in the question.
Find the coordinates of these points: and .
Calculate the slope using .
Write the equation of the secant line using the point-slope form: .
Try solving on your own before revealing the answer!
Final Answer:
The equation of the secant line is , where is the slope calculated from the two points and is found using one of the points.
For example, if the points are and , then and .
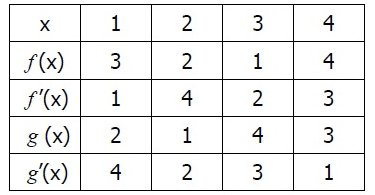
Q2. Given the table below, calculate the following derivatives:
Background
Topic: Product and Quotient Rule for Derivatives
This question tests your ability to use the product and quotient rules to find derivatives using values from a table.
Key Terms and Formulas:
Product Rule:
Quotient Rule:
Step-by-Step Guidance
For , use the product rule: .
Locate the values of , , , and for the specified in the table.
Plug these values into the product rule formula for the required (e.g., ).
For , use the quotient rule: .
Locate the values for the specified and substitute them into the quotient rule formula.
Try solving on your own before revealing the answer!
Final Answer:
For , substitute the values from the table into .
For , substitute the values from the table into .
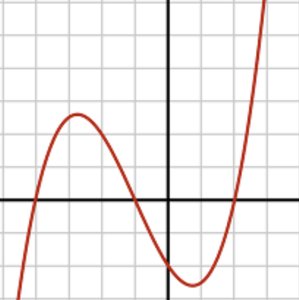
Q3. Find the critical values for and use the First and Second Derivative Test to assess if a critical value is an extrema for .
Background
Topic: Critical Points and Extrema
This question tests your ability to find critical points by setting the first derivative to zero and then use the first and second derivative tests to determine if those points are maxima, minima, or neither.
Key Terms and Formulas:
Critical Point: Where or is undefined.
First Derivative Test: Examines sign changes in around critical points.
Second Derivative Test: Uses at critical points to determine concavity.
Step-by-Step Guidance
Find for .
Set and solve for to find critical points.
For , find and .
Use the first derivative test: Check the sign of before and after each critical point.
Use the second derivative test: Evaluate at each critical point to determine if it is a maximum or minimum.
Try solving on your own before revealing the answer!
Final Answer:
Critical values are found by solving . Use the first and second derivative tests to classify each critical value as a local maximum, minimum, or neither.
For , check the sign of and the value of at each critical point.
