 Back
BackBusiness Calculus Final Exam Study Guide – Step-by-Step Guidance
Study Guide - Smart Notes
 Tailored notes based on your materials, expanded with key definitions, examples, and context.
Q2. A company manufactures memory chips for microcomputers. Its marketing research department, using statistical techniques, collected the data shown in the table below, where is the wholesale price per chip at which million chips can be sold. Using special analytical techniques, an analyst produced the following price-demand function to model the data: , where .
Background
Topic: Linear Functions and Revenue Modeling
This question tests your ability to interpret and graph linear price-demand functions, estimate prices for given demand levels, and construct and analyze revenue functions in a business context.
Key Terms and Formulas
Price-demand function:
Revenue function:
Domain: (million chips)
Step-by-Step Guidance
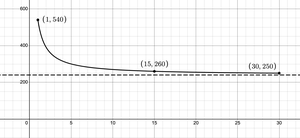
Understand that the price-demand function is linear, meaning price decreases as demand increases.
To estimate the price for a specific demand, substitute the value of (e.g., or ) into the price-demand function.
To write the revenue function, multiply the price-demand function by the number of units sold: .
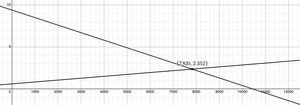
To graph the price-demand function, plot points for values within the domain and connect them to show the linear relationship. For the revenue function, plot for values in the domain to visualize how revenue changes with demand.
Try solving on your own before revealing the answer!
Final Answer:
(b) For , ; for , .
(c) Revenue function: .
The price-demand graph is linear and the revenue graph is a downward-opening parabola, showing maximum revenue at a certain demand level.
