 Back
BackBusiness Calculus Practice Test Guidance: Limits, Continuity, Derivatives, and Applications
Study Guide - Smart Notes
 Tailored notes based on your materials, expanded with key definitions, examples, and context.
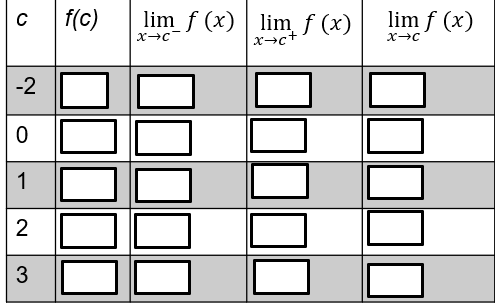
Q2. Use the graph of to complete the table (fill in each box with a number, or “DNE” if it does not exist)
Background
Topic: Limits and Continuity from Graphs
This question tests your ability to interpret a graph to determine function values and limits from both the left and right at specific points. It also checks your understanding of when limits exist and how to recognize discontinuities.
Key Terms and Formulas:
: The value of the function at (look for closed circles on the graph).
: The limit as approaches from the left (follow the graph as $x$ increases toward $c$).
: The limit as approaches from the right (follow the graph as $x$ decreases toward $c$).
: The limit as approaches from both sides (exists only if left and right limits are equal).
DNE: "Does Not Exist" (use this if the limit or function value is not defined at that point).
Step-by-Step Guidance
For each value in the table, locate the corresponding point on the graph. Check if there is a closed circle at to determine .
To find , trace the graph from the left side of and observe the -value the graph approaches as gets close to $c$.
To find , trace the graph from the right side of and observe the -value the graph approaches as gets close to $c$.
Compare the left and right limits. If they are equal, exists and equals that value. If not, write "DNE" for the overall limit.
If there is an open circle at , the function value may not be defined there, so check carefully.
Try solving on your own before revealing the answer!
Final Answer:
Here is the completed table based on the graph:
c | ||||
|---|---|---|---|---|
-2 | 0 | 0 | 2 | DNE |
0 | 2 | 2 | 2 | 2 |
1 | DNE | 3 | 2 | DNE |
2 | 2 | 2 | 5 | DNE |
3 | 4 | 5 | 4 | DNE |
Each entry is determined by carefully reading the graph: closed circles indicate , limits are found by following the graph from each side, and "DNE" is used when limits do not match or the function is not defined.
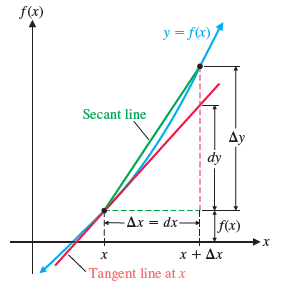
Q13. Use the diagram to answer questions about and .
Background
Topic: Differentials and Tangent/Secant Lines
This question tests your understanding of the geometric meaning of differentials () and changes in function values (), as well as their relationship to secant and tangent lines.
Key Terms and Formulas:
: The actual change in the function value as increases by .
: The approximate change in given by the tangent line at .
Secant line: Connects two points on the curve, representing average rate of change.
Tangent line: Touches the curve at one point, representing instantaneous rate of change.
Step-by-Step Guidance
Look at the diagram and identify as the vertical distance between and .
Identify as the vertical distance predicted by the tangent line, which is .
Consider when : this happens when is very small, so the secant and tangent lines are nearly the same.
Think about why for linear functions: the tangent and secant lines coincide, so the actual and predicted changes are equal.
Try solving on your own before revealing the answer!
Final Answer:
represents the actual change in as increases by ; it is the difference .
represents the change in predicted by the tangent line at , calculated as .
when is very small, so the curve is nearly linear over that interval.
whenever is linear, because the tangent and secant lines are identical and the actual and predicted changes match exactly.
The diagram visually shows how and relate to secant and tangent lines, and why they are equal for linear functions.
