 Back
BackBusiness Calculus Study Notes: Functions, Graphs, and Applications
Study Guide - Smart Notes
 Tailored notes based on your materials, expanded with key definitions, examples, and context.
Chapter 1: Functions and Graphs
1.1 Functions
Understanding functions is foundational in business calculus, as they model relationships between variables such as cost, revenue, and profit. This section introduces the concept of functions, their graphical representation, and their applications in business contexts.
Graphs of Equations: The graph of an equation in two variables (x and y) is a visual representation of all solutions to the equation. For example, the graph of is a parabola.
Functions Specified by Equations: An equation specifies a function if each input (x) produces exactly one output (y). If an input yields multiple outputs, it is not a function.
Vertical Line Test: A graph represents a function if no vertical line intersects the graph at more than one point.
Domain of a Function: The domain is the set of all possible input values (x) for which the function is defined.
Profit-Loss Analysis: In business, profit is calculated as revenue minus cost: .
Price-Demand Analysis: The price-demand function relates the price of a product to the quantity demanded. Revenue is given by .
Example: For the price-demand function (where ), the revenue function is .
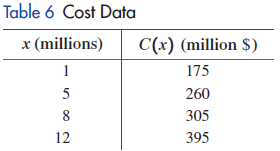
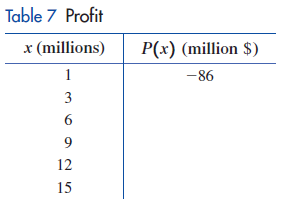
Tables: Cost and Profit Data
Tabular data is often used to analyze cost and profit in business scenarios.
x (millions) | C(x) (million $) |
|---|---|
1 | 175 |
5 | 260 |
8 | 305 |
12 | 395 |
x (millions) | P(x) (million $) |
|---|---|
1 | -86 |
3 | |
6 | |
9 | |
12 | |
15 |
1.2 A Library of Elementary Functions
Elementary functions are the building blocks for modeling business scenarios. Their graphs and properties are essential for understanding more complex functions.
Identity Function:
Square Function:
Cube Function:
Square Root Function:
Cube Root Function:
Absolute Value Function:
Example: The domain of is , and its range is .
Transformations of Functions
Transformations allow us to shift, stretch, shrink, or reflect the graphs of functions, which is useful for modeling changes in business variables.
Vertical Shift: shifts the graph up or down by units.
Horizontal Shift: shifts the graph left or right by units.
Reflection: reflects the graph across the x-axis.
Vertical Stretch/Shrink: stretches if , shrinks if .
Example: The graph of is the graph of shifted up by 5 units.
Piecewise-Defined Functions
Piecewise-defined functions are used to model situations where a rule changes depending on the input value. These are common in business for tiered pricing or cost structures.
Example:
1.3 Linear and Quadratic Functions
Linear Functions, Equations, and Inequalities
Linear functions model relationships with constant rates of change, such as cost per item or revenue per sale. Their graphs are straight lines.
Slope Formula:
Intercepts: The x-intercept is where the line crosses the x-axis, and the y-intercept is where it crosses the y-axis.
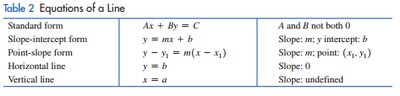
Forms of Linear Equations:
Form | Equation | Notes |
|---|---|---|
Standard | A and B not both 0 | |
Slope-intercept | Slope: m, y-intercept: b | |
Point-slope | Slope: m, point: | |
Horizontal line | Slope: 0 | |
Vertical line | Slope: undefined |
Quadratic Functions, Equations, and Inequalities
Quadratic functions model scenarios with variable rates of change, such as profit maximization or cost analysis. Their graphs are parabolas.
Standard Form: ,
Axis of Symmetry:
Vertex:
Quadratic Formula:
Domain: All real numbers
Range: if or if
Example: For , the vertex form is where is the vertex.
Applications: Supply, Demand, and Profit Maximization
Business calculus uses linear and quadratic functions to model supply and demand, equilibrium price, and profit maximization.
Equilibrium Price: The price at which supply equals demand.
Profit Function: , where is revenue and is cost.
Maximizing Profit: Find the vertex of the profit function to determine the production level that yields maximum profit.
Example: For and , the profit function is .
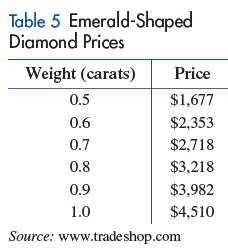
Linear and Quadratic Regression
Regression analysis is used to find the best-fit line or curve for a set of data points, which helps in predicting future values and making business decisions.
Linear Regression: Finds the best linear model for a set of data.
Quadratic Regression: Finds the best quadratic model for a set of data.
Weight (carats) | Price ($) |
|---|---|
0.5 | 1,677 |
0.6 | 2,353 |
0.7 | 2,718 |
0.8 | 3,218 |
0.9 | 3,982 |
1.0 | 4,510 |
Additional info: These notes cover the essential concepts and applications of functions, graphs, and their transformations, as well as linear and quadratic modeling in business calculus. The included tables and images reinforce the connection between mathematical models and real-world business data.
