 Back
Business Calculus Study Notes: The Derivative
Study Guide - Smart Notes
 Tailored notes based on your materials, expanded with key definitions, examples, and context.
Chapter 1: The Derivative
1.1 The Slope of a Straight Line
The concept of slope is foundational in calculus, representing the steepness of a function. Understanding slope in straight lines helps us later interpret slope in curves.
Slope-Intercept Form: The equation of a nonvertical line is , where m is the slope and b is the y-intercept.
Slope Formula: (rise over run).
Economic Interpretation: In cost functions like , the slope (2) is the marginal cost (cost per additional unit), and the y-intercept (1000) is the fixed cost.
Point-Slope Form: , useful for writing equations given a point and slope.
Parallel Lines: Same slope, different y-intercepts; never intersect.
Perpendicular Lines: Slopes are opposite reciprocals; .
Example: The equation (oil tank) has a y-intercept of 30,000 gallons (initial amount) and a slope of -400 (oil used per day).
1.2 The Slope of a Curve at a Point
To find the slope of a curve at a specific point, we use the concept of a tangent line, which touches the curve at one point and approximates its slope there. The slope of the tangent line is the slope of the curve at that point.
Secant Line: Connects two points on a curve; its slope approximates the tangent as the points get closer.
Instantaneous Rate of Change: As the secant line approaches the tangent, we find the instantaneous slope.
Example: For at , the slope of the tangent line is 2.
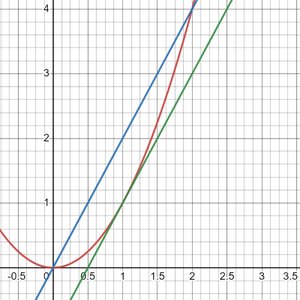
Rate of Change: The slope at a point on a graph represents the rate of change at that instant.
1.3 The Derivative and Limits
The derivative of a function gives the slope of the curve at any point. For , the derivative is , also written as .
Linear Functions: The derivative is the slope ; for , .
Power Rule: If , then .
Example: For , ; for , .
Geometric Meaning: is the slope of the tangent line to at .
Point-Slope Equation for Tangent Line:
Difference Quotient: as gives the derivative.
1.4 Limits and the Derivative
The concept of a limit is central to calculus. The limit describes the value a function approaches as the input approaches a certain point.
Definition: if gets arbitrarily close to as approaches .
Basic Limits: (constant), .
Limit Theorems: Sum, difference, product, quotient, and power rules for limits.
Difference Quotient:
Limits at Infinity: Analyze behavior as or .
Example:
1.5 Differentiability and Continuity
A function is differentiable at a point if its derivative exists there. Common reasons for non-differentiability include discontinuities, abrupt changes, or vertical tangents.
Continuity: A function is continuous at if is defined, exists, and .
Relationship: Differentiability implies continuity, but not vice versa.
Example: Piecewise cost functions may be continuous but not differentiable at certain points.
1.6 Rules of Differentiation
Several rules simplify the process of finding derivatives:
Constant Multiple Rule:
Sum Rule:
General Power Rule:
Example:
1.7 More about Derivatives
Derivatives can be taken with respect to any variable, and higher-order derivatives (second, third, etc.) are possible.
Second Derivative: , measures the rate of change of the rate of change.
Estimation: for small changes.
Example: Marginal cost and marginal revenue use derivatives to estimate changes in economics.
1.8 The Derivative as a Rate of Change
The derivative represents the instantaneous rate of change, while the secant line gives the average rate of change over an interval.
Average Rate of Change:
Instantaneous Rate of Change:
Velocity: , where is position.
Acceleration:
Example: For , velocity and acceleration can be found using derivatives.
Application: Slope as Rate of Change
In practical scenarios, the slope of a graph at a point represents the rate of change of a quantity, such as oil consumption over time.
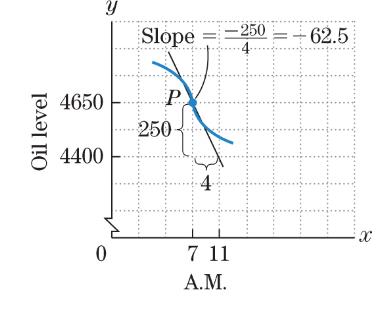
Example: The slope at point P on the oil level graph is -62.5, indicating a decrease of 62.5 gallons per hour.
Summary Table: Basic Derivative Rules
Rule | Formula | Example |
|---|---|---|
Power Rule | ||
Constant Rule | ||
Sum Rule | ||
Constant Multiple |
Additional info: These notes expand on the original material with academic context, definitions, and examples for clarity and completeness.
