 Back
BackChapter 0: Functions – Foundations for Business Calculus
Study Guide - Smart Notes
 Tailored notes based on your materials, expanded with key definitions, examples, and context.
Functions and Their Graphs
Rational & Irrational Numbers
Understanding the types of numbers is foundational for calculus. Rational numbers are numbers that can be expressed as the quotient of two integers, while irrational numbers cannot be written as such a quotient. Both types are part of the real number system.
Rational numbers: Examples include , , .
Irrational numbers: Examples include , , .
The Number Line
The number line is a geometric representation of real numbers, where each point corresponds to a unique real number. It is used to visualize intervals, inequalities, and the relative position of numbers.
Open interval (a, b): All numbers between a and b, not including a or b.
Closed interval [a, b]: All numbers between a and b, including both endpoints.
Open & Closed Intervals
Intervals are used to describe sets of numbers on the number line:
Open interval (a, b):
Closed interval [a, b]:
Half-open intervals: [a, b) or (a, b]
Functions in Application
Biological Example: Muscle Response
Functions can model real-world phenomena. For example, the response of a frog's heart muscle to acetylcholine can be modeled by:
x: Concentration of acetylcholine
b: Positive constant depending on the frog
R(x): Response as a percentage of maximum effect
Example: If and , then .
Application: Such models are common in biology, chemistry, and economics to describe saturation effects.
Graphs of Functions
The Vertical Line Test
The vertical line test is used to determine if a graph represents a function. If any vertical line crosses the graph more than once, the graph does not represent a function.
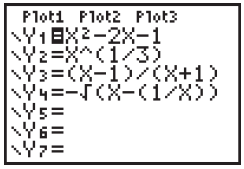
Graphing Calculators
Graphing calculators are valuable tools for visualizing functions. They allow users to input equations, set window parameters, and view graphs.
Equation entry: Input functions such as .
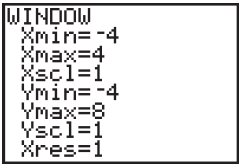
Window settings: Define the viewing window for the graph (e.g., , ).
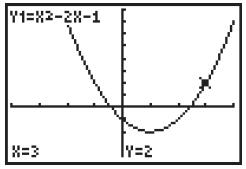
Graphs of Equations
To determine if a point lies on the graph of a function, substitute the x-value into the function and check if the resulting y-value matches the point.
Example: For , is (3, 12) on the graph?
Calculate (not 12), so (3, 12) is not on the graph.
Some Important Functions
Linear Equations
A linear function has the form , where m is the slope and b is the y-intercept. Linear functions are used extensively in business for modeling cost, revenue, and other relationships.
Example: In enzyme kinetics, a linear function can model the relationship between substrate concentration and reaction rate.
Piecewise Functions
A piecewise function is defined by different expressions for different intervals of the domain.
Graph each piece on its specified interval.
Combine the pieces to form the complete graph.
Quadratic, Polynomial, Rational, Power, and Absolute Value Functions
These are common types of functions encountered in calculus:
Quadratic:
Polynomial:
Rational:
Power:
Absolute Value:
The Algebra of Functions
Adding, Subtracting, Multiplying, and Dividing Functions
Functions can be combined using algebraic operations:
Addition:
Subtraction:
Multiplication:
Division: ,
Composition of Functions
The composition of two functions and is written as . This is used to combine processes or conversions, such as converting units between systems.
Example: If converts British hat sizes to French, and converts French to U.S., then converts British to U.S. sizes.
Zeros of Functions – The Quadratic Formula and Factoring
Zeros of Functions
The zeros of a function are the x-values where . For quadratics, these can be found using the quadratic formula:
Factoring
Factoring is a method for finding zeros by expressing a polynomial as a product of simpler polynomials.
Set each factor equal to zero to solve for x.
Exponents and Power Functions
Exponents
Exponents are used to express repeated multiplication. The laws of exponents include:
Applications of Exponents
Exponents are used in compound interest, population growth, and other business applications.
Compound Interest
Compound interest is calculated using:
P: Principal
r: Annual interest rate
m: Number of compounding periods per year
t: Number of years
Functions and Graphs in Application
Geometric Problems
Functions can model geometric scenarios, such as the area and fencing of a rectangular corral:
Area:
Fencing (with partitions): (if two partitions parallel to y)
Cost Problems
Cost functions can include different rates for boundaries and partitions:
Boundary cost:
Partition cost:
Total cost:
Surface Area
For a box with dimensions x, y, z, the surface area is:
Cost, Revenue, and Profit
Business calculus often involves modeling cost, revenue, and profit:
Revenue function:
Cost function: (may include fixed and variable costs)
Profit function:
Example: If and , then .
Functions & Graphs in Application
Graphs can be used to interpret cost, revenue, and other business functions. For example, the minimum point on a cost graph may represent the most cost-effective option.
Summary Table: Key Function Types
Type | General Form | Example |
|---|---|---|
Linear | ||
Quadratic | ||
Polynomial | ||
Rational | ||
Power | ||
Absolute Value |
