 Back
BackGraphs and Properties of Linear and Nonlinear Functions in Business Calculus
Study Guide - Smart Notes
 Tailored notes based on your materials, expanded with key definitions, examples, and context.
Graphs and Properties of Functions
Linear and Nonlinear Functions
Understanding the graphical behavior of functions is fundamental in business calculus, as it allows for the analysis of trends, optimization, and prediction. Functions can be classified as linear or nonlinear based on their algebraic form and graphical characteristics.
Linear Functions: These functions have the form , where is the slope and is the y-intercept. Their graphs are straight lines.
Nonlinear Functions: These include quadratic, cubic, and other polynomial or exponential functions. Their graphs are curves and can exhibit turning points, inflection points, and asymptotic behavior.
Applications: Linear functions are used for modeling constant rates of change, while nonlinear functions model variable rates, growth, and decay.
Key Features of Function Graphs
Graphical analysis involves identifying critical points, intercepts, and the general shape of the function. These features are essential for understanding the behavior of business-related models.
Intercepts: Points where the graph crosses the axes. The y-intercept is found by setting ; the x-intercept by setting .
Turning Points: Points where the function changes direction (local maxima or minima).
Inflection Points: Points where the curvature of the graph changes.
Asymptotes: Lines that the graph approaches but never touches, often seen in rational or exponential functions.
Examples of Function Graphs
The following images illustrate various types of function graphs relevant to business calculus:
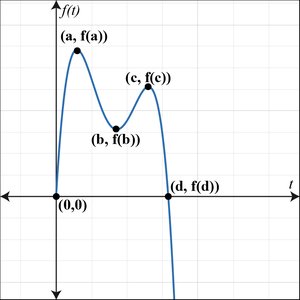
Graph of a General Nonlinear Function
This graph shows a function with multiple turning points and labeled coordinates, useful for identifying local maxima, minima, and points of interest.
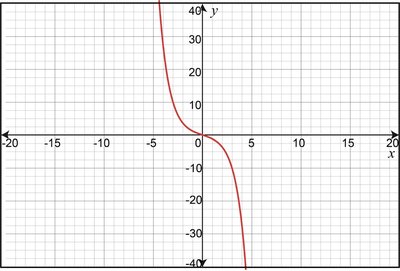
Graph of a Cubic Function (Decreasing)
A cubic function can exhibit both increasing and decreasing behavior, with inflection points where the curvature changes.
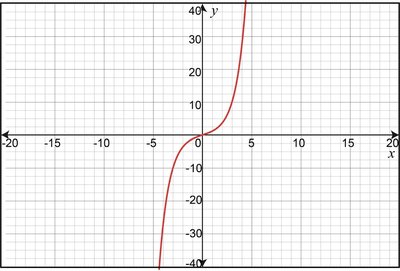
Graph of a Cubic Function (Increasing)
This graph represents a cubic function with an overall increasing trend, showing both concave and convex regions.
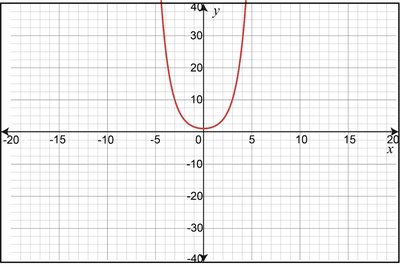
Graph of a Quadratic Function (Upward Opening)
Quadratic functions have the form . When , the parabola opens upward, indicating a minimum point.
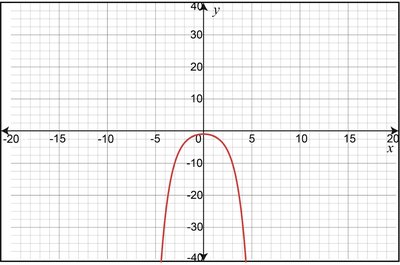
Graph of a Quadratic Function (Downward Opening)
When , the parabola opens downward, indicating a maximum point.
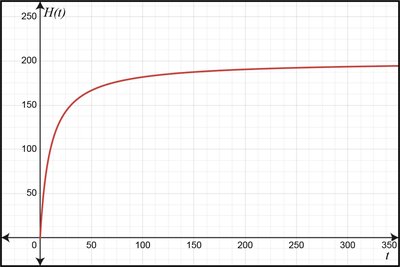
Graph of an Exponential Function
Exponential functions model rapid growth or decay, commonly used in business for modeling population, investments, and depreciation.
Summary Table: Function Types and Their Properties
Function Type | General Form | Graph Shape | Key Features |
|---|---|---|---|
Linear | Straight line | Constant slope, no turning points | |
Quadratic | Parabola | One turning point (vertex), opens up/down | |
Cubic | S-shaped curve | Inflection point, up to two turning points | |
Exponential | Rapid growth/decay | Asymptote, no turning points |
Applications in Business Calculus
Optimization: Identifying maxima and minima helps in maximizing profit or minimizing cost.
Trend Analysis: Understanding the shape and behavior of functions aids in forecasting and decision-making.
Modeling: Functions are used to model real-world business scenarios such as revenue, cost, and demand.
Additional info: The images provided are directly relevant to the graphical analysis of functions, a core topic in business calculus. The notes expand on the visual content to ensure academic completeness.
