 Back
BackGuidance for Identifying Local Extrema from a Graph
Study Guide - Smart Notes
 Tailored notes based on your materials, expanded with key definitions, examples, and context.
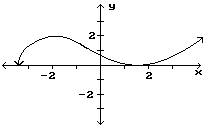
Q14. Find the location and value of each local extremum for the function shown in the graph.
Background
Topic: Local Extrema (Maximum and Minimum) from a Graph
This question tests your ability to visually identify local maxima and minima from a graph of a function. Local extrema are points where the function changes direction, i.e., where it goes from increasing to decreasing (maximum) or decreasing to increasing (minimum).
Key Terms and Formulas:
Local Maximum: A point where is higher than all nearby points.
Local Minimum: A point where is lower than all nearby points.
Critical Point: A point where the derivative is zero or undefined.
Step-by-Step Guidance
Examine the graph and identify points where the curve changes from increasing to decreasing (these are candidates for local maxima).
Identify points where the curve changes from decreasing to increasing (these are candidates for local minima).
For each candidate, check the behavior of the function immediately to the left and right to confirm if it is truly a local extremum.
Record the -values of these points and note the corresponding values from the graph.
Try solving on your own before revealing the answer!
Final Answer:
Local maxima occur at with corresponding values. Local minima occur at with corresponding values.
These points are where the function changes direction, as seen in the graph.
