 Back
BackGuidance for Identifying Local Extrema from a Graph
Study Guide - Smart Notes
 Tailored notes based on your materials, expanded with key definitions, examples, and context.
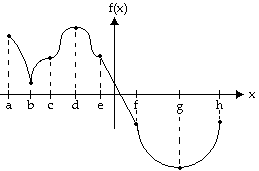
Q14. Find the location and value of each local extremum for the function shown in the graph.
Background
Topic: Local Extrema (Maximum and Minimum) from Graphs
This question tests your ability to identify local maxima and minima by analyzing the graph of a function. Local extrema are points where the function changes direction, typically at peaks (maxima) or valleys (minima).
Key Terms and Formulas:
Local Maximum: A point where the function value is higher than at nearby points.
Local Minimum: A point where the function value is lower than at nearby points.
Critical Point: A point where the derivative is zero or undefined.
First Derivative Test: Used to determine if a critical point is a local max or min by checking the sign change of .
Step-by-Step Guidance
Examine the graph and identify points where the function changes from increasing to decreasing (local maxima) or from decreasing to increasing (local minima).
Look for peaks and valleys on the graph. These are typically marked by vertical dashed lines at points labeled a, b, c, d, e, f, g, h.
For each labeled point, check the behavior of the function immediately to the left and right. If the function goes up then down, it's a local maximum; if it goes down then up, it's a local minimum.
Record the x-values where these extrema occur. You can estimate the y-values by looking at the height of the graph at these points.
Try solving on your own before revealing the answer!
Final Answer:
Local maxima occur at x = b, d. Local minima occur at x = a, c, g, h. The values can be estimated from the graph at these points.
Each extremum is identified by observing where the function changes direction at the labeled points.
