 Back
Probability Concepts and Applications in Business Calculus
Study Guide - Smart Notes
 Tailored notes based on your materials, expanded with key definitions, examples, and context.
Probability and Mathematical Experiments
Random Experiments, Sample Spaces, and Events
Probability theory begins with the study of random experiments, which are activities or observations whose outcomes cannot be predicted ahead of time. The set of all possible outcomes is called the sample space (denoted as ), and any subset of the sample space is called an event.
Random Experiment: An activity with unpredictable outcomes (e.g., rolling a die, drawing a card).
Outcome: A possible result of a random experiment.
Sample Space (): The set of all possible outcomes.
Event (): A subset of the sample space; a collection of outcomes.
Simple Event: An event with exactly one outcome.
Certain Event: The event containing all outcomes ().
Impossible Event: The event containing no outcomes ().
Example: Rolling a standard six-sided die: .
Example: Drawing a card from a deck: contains all 52 cards.
Operations on Events and Venn Diagrams
Visualizing Events with Venn Diagrams
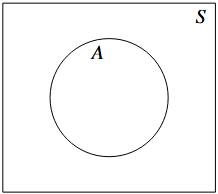
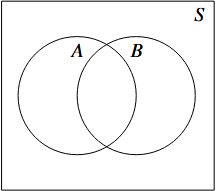
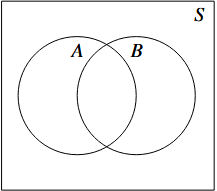
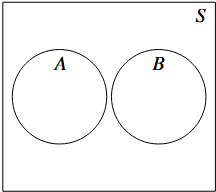
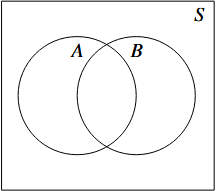
Venn diagrams are used to visually represent relationships between events within a sample space. Each circle represents an event, and the rectangle represents the sample space.
Complement (): The set of outcomes in not in .
Intersection (): Outcomes common to both and .
Union (): Outcomes in , , or both.
Mutually Exclusive: Events and are mutually exclusive if .
Example: If is the event "rolling an even number" and is "rolling a number greater than 4" on a die, is "rolling a 6".
DeMorgan's Laws:
Symbolic and Verbal Notation:
Operation | Symbolic | Verbal |
|---|---|---|
Complement | NOT | |
Intersection | AND | |
Union | OR |
Relevant Images:
Basics of Probability
Uniform Sample Spaces and Probability Calculation
In a uniform sample space, all outcomes are equally likely. The probability of an event is:
Probability values range from 0 to 1.
A fair die or fair coin means all outcomes are equally likely.
Example: Probability of drawing a spade from a deck: .
Types of Probability
Theoretical Probability: Calculated using mathematical formulas.
Empirical Probability: Based on repeated experiments or observations.
Subjective Probability: Based on intuition or experience (not discussed in detail).
Probability Distributions
Probability Distribution Tables
A probability distribution lists all possible outcomes and their probabilities. The sum of all probabilities must be 1.
Outcome | Probability |
|---|---|
0 | |
1 | |
2 | |
3 |
Example: Rolling two four-sided dice and noting the sum.
Rules of Probability
Union and Complement Rules
for any event
Union Rule:
Complement Rule:
If and are mutually exclusive:
Probability Distributions and Expected Value
Random Variables and Expected Value
A random variable () assigns a numerical value to each outcome of an experiment. The expected value () is the average value if the experiment is repeated many times.
Example: If can take values 2, 4, 6, 8, 10 with probabilities , then:
Histograms of Probability Distributions
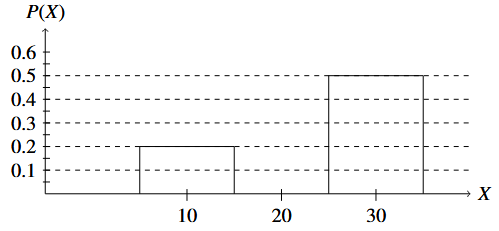
A histogram visually represents a probability distribution, with the -axis showing values of the random variable and the -axis showing probabilities.
Fair Games and Expected Net Winnings
A mathematical game is fair if the expected profit for both sides is zero. The player should pay an amount equal to their expected winnings for fairness.
Expected Net Winnings: The expected value minus the cost to play.
Example: Drawing a card from a deck with different payouts for face cards, aces, and number cards. Calculate expected winnings and compare to the cost to play.
Summary Table: Probability Concepts
Concept | Definition | Formula |
|---|---|---|
Probability of Event | Chance of event occurring | |
Union | Either event occurs | |
Complement | Event does not occur | |
Expected Value | Average outcome |
