- Download the worksheet to save time writing
- Start solving the practice problems
- If you're stuck, watch the video solutions
- See your summary to get more insights

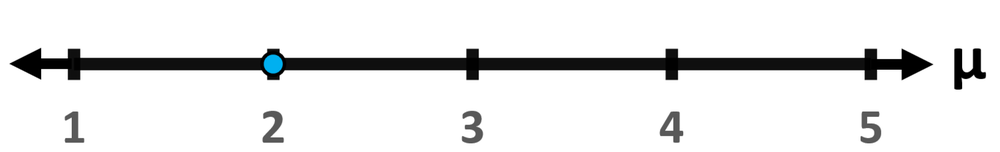
State the null hypothesis represented by the following graph. Then, state the alternative hypothesis and sketch its graph.
For a left-tailed -test with and a sample size of , find the critical value and rejection region.
A quality control manager claims that the variance in the lifespans of a certain type of lightbulb is exactly . To test this claim, a random sample of bulbs is selected, and the sample variance is found to be . At the significance level, test the manager's claim. Assume the lifespans are normally distributed.
A Kruskal–Wallis test is used to compare the wait time distributions at three different service centers. The calculated test statistic is:
At the significance level, the critical value from the chi-square distribution with is:
Based on this information, should the null hypothesis be rejected?
A researcher investigates how the temperature of an oven (in ) affects the time (in minutes) needed to bake a loaf of bread. After collecting data from several test bakes, a regression equation was developed, where is the oven temperature. What does the symbol represent in this equation?
A researcher collects data on the number of hours spent exercising per week and cholesterol levels for a random sample of adults. The Spearman rank correlation coefficient calculated from the data is . At , is there a significant correlation between hours of exercise and cholesterol levels? Use a two-tailed test.
Given a confidence level of and a sample size of , what are the critical values for the -distribution?
Researchers evaluated two study techniques for passing a certification exam. Out of students using active recall, passed the exam. Out of students using re-reading, passed. Does the difference in pass rates between the two techniques appear to have practical significance?
Determine whether the following hypothesis test is left-tailed, right-tailed, or two-tailed.
A quality engineer is comparing the strength variability of steel rods produced by two different rolling mills. From each mill she takes an independent sample of rods, computes the sample variances and , and forms the test statistic .
True or False: If is very close to , then the two samples have essentially the same variability.