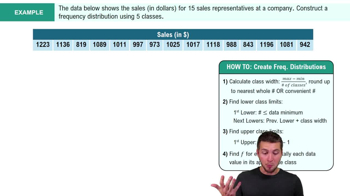
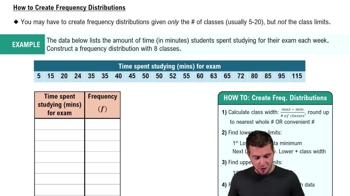
A frequency distribution is a table showing the number of data observations in specific intervals or classes, organizing raw data into meaningful groups.
How do you calculate class width in a frequency distribution?
Class width = \(\frac{\text{Max Value} - \text{Min Value}}{k}\), where k is the number of classes.
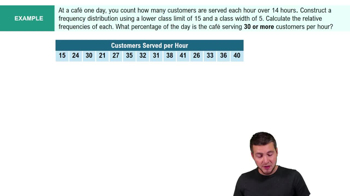
What is the formula for relative frequency?
Relative frequency = \(\frac{\text{Class Frequency}}{\text{Total Observations}}\), showing the proportion of observations in each class.
What does a cumulative relative frequency distribution represent?
It totals the proportion of observations less than or equal to a given class, calculated as the sum of relative frequencies up to that class.
Describe a histogram and its characteristics.
A histogram is a bar graph for quantitative data where bars touch, representing frequency of classes. It shows data distribution shapes like symmetric or skewed.
What is the difference between a polygon and an ogive?
A polygon connects class midpoints with frequencies as points, while an ogive graphs cumulative frequencies to identify medians and percentiles.
What is a stem and leaf display used for?
It splits data into stems (larger place values) and leaves (smaller place values) to graphically describe distribution while preserving original data.
What is the purpose of a scatter plot?
A scatter plot visually shows the relationship between two quantitative variables, helping identify correlation and trends.
When is a line chart typically used?
A line chart connects data points over time to show trends or changes in a quantitative variable.
How is frequency distribution applied to qualitative data?
It shows counts and proportions for categories, organizing qualitative data like grades or survey responses.
What is a bar chart used for in qualitative data?
A bar chart displays frequencies or proportions of categories, useful for comparing qualitative data values.
What distinguishes a Pareto chart?
A Pareto chart is a bar chart with categories in descending frequency order, including a cumulative frequency line, often used in quality control.
What is the function of a pie chart?
A pie chart compares proportions of categories in qualitative data, with each slice representing a category's share of the total.
What does a contingency table show?
It displays frequencies of two qualitative variables, showing the breakdown of one variable in terms of another to analyze relationships.
How do you activate the Analysis ToolPak in Excel?
Go to File > Options > Add-Ins > Manage Excel Add-ins > Go > Check Analysis ToolPak > OK.
How do you construct a frequency table in Excel?
Use the FREQUENCY function: \(=\text{FREQUENCY}(\text{data range}, \text{bin range})\) or use Data Analysis > Histogram.
What is the main objective of a frequency table?
To organize and summarize quantitative or qualitative data by showing the number of observations in each class or category.
What type of data is best displayed with a histogram?
Quantitative data, showing the distribution of variable values across classes.
What type of data is best displayed with a bar chart or pie chart?
Qualitative (categorical) data, to compare frequencies or proportions across categories.
What is the formula for the number of classes using the rule of thumb?
Number of classes \(>= 2 \sqrt{n}\), where n is the number of data points.
 Back
 06:19