 Back
BackAdvanced Topics in Time Series Regression: Vector Autoregression, Cointegration, and Volatility Modeling
Study Guide - Smart Notes
 Tailored notes based on your materials, expanded with key definitions, examples, and context.
Additional Topics in Time Series Regression
Overview of Advanced Time Series Models
Advanced time series regression models extend the basic concepts of autoregressive and distributed lag models to address complex relationships between multiple variables, trends, and volatility. These models are essential for forecasting, causal analysis, and understanding dynamic systems in business and economics.
Vector Autoregression (VAR): Simultaneously predicts multiple time series variables.
Multiperiod Forecasts: Extends forecasting to several periods ahead.
Order of Integration: Determines the degree of differencing needed for stationarity.
Cointegration: Identifies common stochastic trends between series.
Volatility Clusters (ARCH/GARCH): Models time-varying volatility in financial data.
Many Predictors: Incorporates multiple variables for improved forecasting.
Vector Autoregression (VAR) Models
Definition and Structure
A Vector Autoregression (VAR) model generalizes the univariate autoregressive model to multiple time series variables. It consists of a system of equations where each variable is regressed on its own lagged values and the lagged values of other variables in the system.
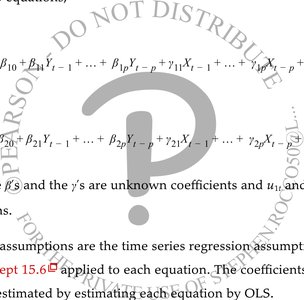
VAR(p) Model: For two time series variables, and , the VAR(p) model is:
Lag Length: Same number of lags for all variables and equations; chosen by information criteria or judgment.
Estimation: Each equation is estimated by ordinary least squares (OLS).
Applications: Forecasting, causal analysis (structural VARs), and policy evaluation.
Example of VAR Model
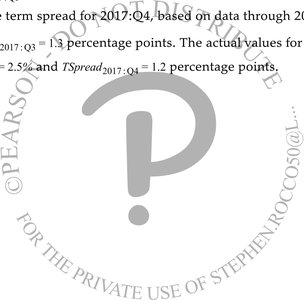
Consider a VAR model with GDP growth rate () and term spread ():
GDPGR Equation:
TSpread Equation:
Choosing Lag Lengths in VARs
The optimal lag length in a VAR can be determined using either F-tests or information criteria (such as BIC or AIC). The process involves selecting the value of p that minimizes the chosen criterion.
Information Criterion: BIC, AIC, or other criteria for system of equations.
F-tests: Used to test the significance of additional lags.
VARs for Causal Analysis
VARs are not only used for forecasting but also for analyzing causal relationships among economic variables. Structural VARs are designed for this purpose, allowing researchers to impose restrictions and test hypotheses about causality.
Structural VAR: Requires further study and identification restrictions.
Applications: Widely used in macroeconomics and econometrics.
Cointegration
Handling Stochastic Trends
Cointegration addresses the issue of spurious regression when time series variables share a common stochastic trend. If two or more series are cointegrated, their long-term relationship can be modeled, even if each series is non-stationary.
Spurious Regression: Occurs when non-stationary series appear to be related due to shared trends.
Cointegration: Indicates a genuine long-term equilibrium relationship between series.
Testing: Requires specialized tests (e.g., Engle-Granger, Johansen).
Volatility Clusters: ARCH and GARCH Models
Modeling Time-Varying Volatility
Financial time series often exhibit volatility clustering, where periods of high volatility are followed by more high volatility. ARCH (Autoregressive Conditional Heteroskedasticity) and GARCH (Generalized ARCH) models are used to capture this behavior.
ARCH Model: Models the variance of the error term as a function of past squared errors.
GARCH Model: Extends ARCH by including lagged variances.
Applications: Used for risk management, asset pricing, and forecasting volatility in financial markets.
Many Predictors in Time Series Models
Balancing Predictive Content and Complexity
Including many predictors in a VAR can improve forecasting but also increases model complexity and the risk of overfitting. The best practice is to use relevant variables and apply methods to reduce dimensionality.
Dimensionality Reduction: Use principal component analysis or variable selection techniques.
Judgment: Avoid including unrelated variables to prevent estimation errors.
Summary Table: Key Features of Advanced Time Series Models
Model | Main Purpose | Key Features | Applications |
|---|---|---|---|
VAR | Forecasting multiple variables | System of equations, lagged values | Macroeconomics, policy analysis |
Cointegration | Modeling long-term relationships | Handles stochastic trends | Econometrics, finance |
ARCH/GARCH | Modeling volatility | Conditional heteroskedasticity | Risk management, asset pricing |
References to Nobel Laureates
Contributions to Time Series Econometrics
Several Nobel laureates have contributed to the development of time series econometric models, including VAR, cointegration, and volatility modeling. Their work has shaped modern econometric practice and financial analysis.


Conclusion
Advanced time series regression models, including VAR, cointegration, and ARCH/GARCH, are essential tools for business statistics and econometrics. They enable researchers and analysts to forecast, test causal relationships, and model volatility in complex economic systems.
