 Back
BackAssociation Between Categorical Variables: Contingency Tables, Lurking Variables, and Strength of Association
Study Guide - Smart Notes
 Tailored notes based on your materials, expanded with key definitions, examples, and context.
Association Between Categorical Variables
Contingency Tables
Contingency tables are fundamental tools in business statistics for analyzing the relationship between two categorical variables. They display the frequency of cases for each combination of categories, allowing for the assessment of associations between variables.
Definition: A contingency table shows counts of cases for combinations of two categorical variables.
Cells: Each cell represents a unique combination and is mutually exclusive.
Marginal Distributions: Totals for each variable, found in the table's margins.
Conditional Distributions: Frequencies within a row or column, restricted to cases meeting a specific condition.
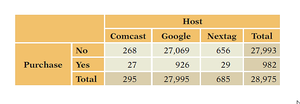
Example: Web Shopping Contingency Table
The table below shows the relationship between Host (originating site) and Purchase (whether a sale occurred).
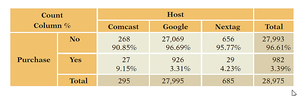
Conditional Distribution Example
Conditional distributions reveal differences in purchase rates across hosts. Comcast has a notably higher purchase rate compared to Nextag.
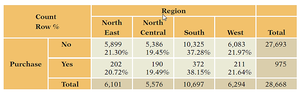
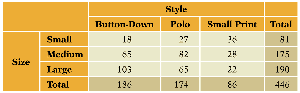
Contingency Table by Region
Contingency tables can also be used to analyze purchases by region, showing both counts and row percentages.
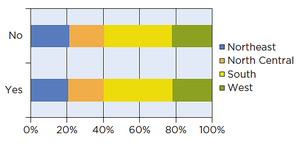
Stacked Bar Charts
Stacked bar charts visually display conditional distributions, dividing bars proportionally by group percentages. They are useful for quickly assessing associations.
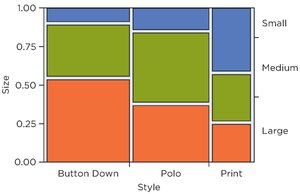
Mosaic Plots
Mosaic plots are an alternative to stacked bar charts. The size of each tile is proportional to the count in a cell, making associations visually apparent.
Lurking Variables and Simpson’s Paradox
Lurking Variables
A lurking variable is a hidden factor that influences the apparent relationship between two other variables. Recognizing lurking variables is crucial to avoid misleading conclusions.
Definition: A concealed variable affecting the relationship between two observed variables.
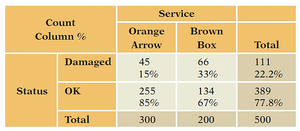
Example: Shipping service appears better until adjusted for package weight.
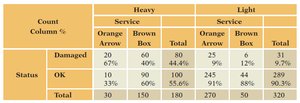
Simpson’s Paradox
Simpson’s Paradox occurs when the association between two variables changes after data is separated into groups defined by a third variable. This highlights the importance of considering all relevant variables.
Strength of Association
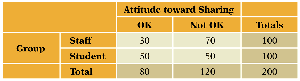
Chi-Squared Statistic
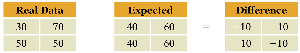
The chi-squared statistic is a measure of association in a contingency table. It compares observed counts to expected counts under the assumption of no association.
Calculation: Accumulates deviations between observed and expected counts across all cells.
Formula: where O is the observed count and E is the expected count.

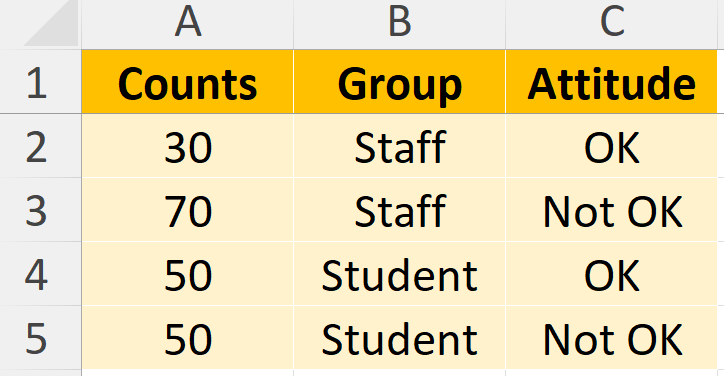
Preparing Data for Analysis
To analyze contingency tables in statistical software (e.g., JMP), remove total rows/columns and represent each count with its associated variables in a single row.
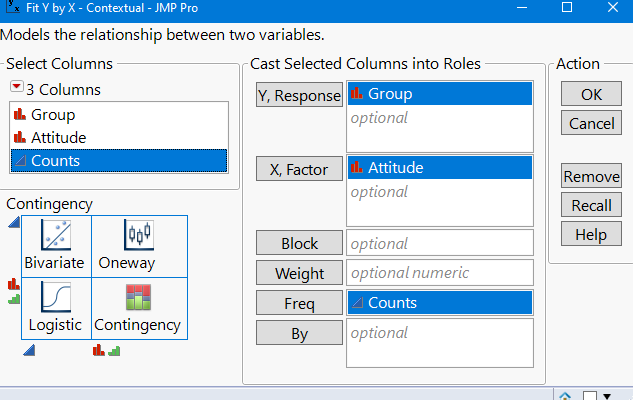
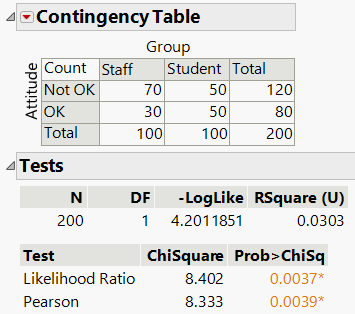
JMP Analysis Example
In JMP, use the 'Fit Y by X' command to analyze the relationship between categorical variables.
Cramer’s V
Cramer’s V is derived from the chi-squared statistic and quantifies the strength of association between two categorical variables.
Range: 0 (no association) to 1 (perfect association).
Formula: where n is the total number of observations and k is the smaller of the number of rows or columns.
Checklist for Chi-Squared and Cramer’s V
Verify that variables are categorical.
Check for lurking variables before interpreting association.
Summary Table: Types of Plots and Their Uses
Plot Type | Main Purpose | Visual Feature |
|---|---|---|
Contingency Table | Displays counts for combinations of categories | Cells with frequencies |
Stacked Bar Chart | Shows conditional distributions | Segmented bars by group |
Mosaic Plot | Visualizes association strength | Tiles sized by cell count |
Key Terms
Contingency Table: Table showing frequencies for combinations of categorical variables.
Marginal Distribution: Totals for each variable.
Conditional Distribution: Frequencies within a subset of data.
Lurking Variable: Hidden variable affecting observed association.
Simpson’s Paradox: Change in association when data is grouped by a third variable.
Chi-Squared Statistic: Measure of association in categorical data.
Cramer’s V: Quantifies strength of association.
Applications in Business Statistics
Analyzing customer purchase behavior across different hosts or regions.
Evaluating product preferences by style and size.
Assessing service quality while accounting for lurking variables.
Using statistical software to test associations and interpret results.
