 Back
BackBusiness Statistics: Measurement, Data Collection, and Measurement Scales
Study Guide - Smart Notes
 Tailored notes based on your materials, expanded with key definitions, examples, and context.
Statistics, Data, and Statistical Thinking
Types of Data and Variables
In business statistics, understanding the nature of data and variables is foundational. Data can be classified based on how it is collected and its intended use in analysis.
Variable: An attribute of the population or process under study that can assume more than one value. Units under study are called variables.
Primary Data: Data collected by the researcher or analyst specifically for use in a particular study.
Secondary Data: Data originally collected for another purpose but used in the current study.


Examples of Data Sources
Data sources can be classified as primary or secondary, with examples illustrating their use in business statistics.
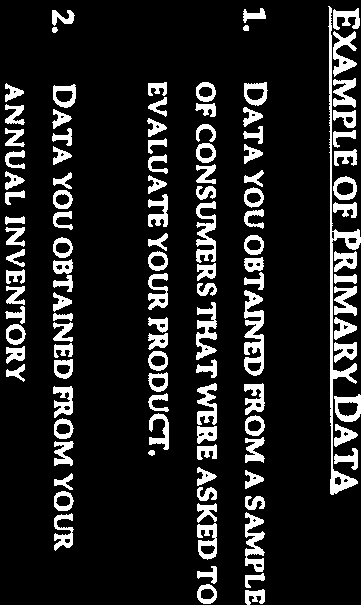
Primary Data Examples:
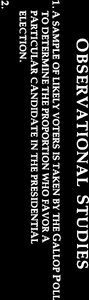
Data obtained from a sample of consumers asked to evaluate a product.
Data obtained from annual inventory.
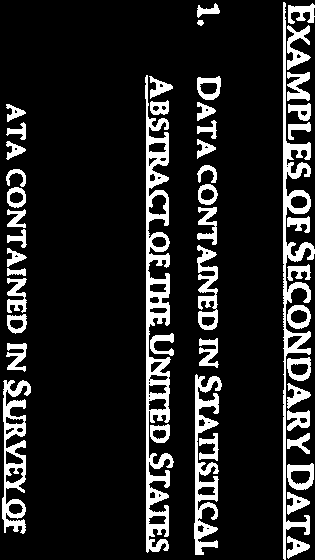
Secondary Data Examples:
Data contained in the Statistical Abstract of the United States.
Data contained in surveys conducted by other organizations.
Primary and Secondary Sources
It is important to distinguish between primary and secondary sources of data, as this affects the reliability and relevance of the data for statistical analysis.
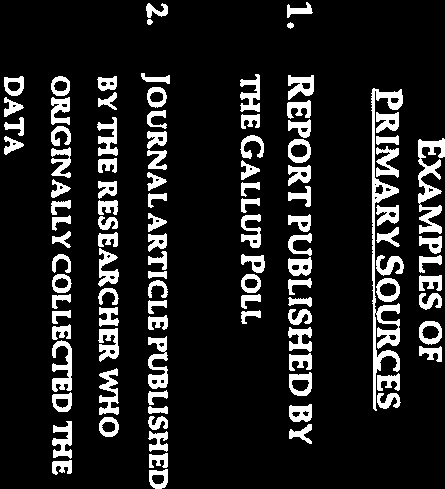
Primary Source: The original collector or publisher of the data (e.g., Gallup Poll report).
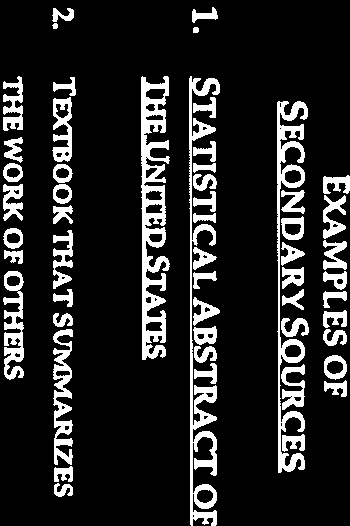
Secondary Source: A source that obtained the data from the primary source (e.g., a textbook summarizing the work of others).
Caveat: If possible, always use the primary source of secondary data to ensure accuracy.


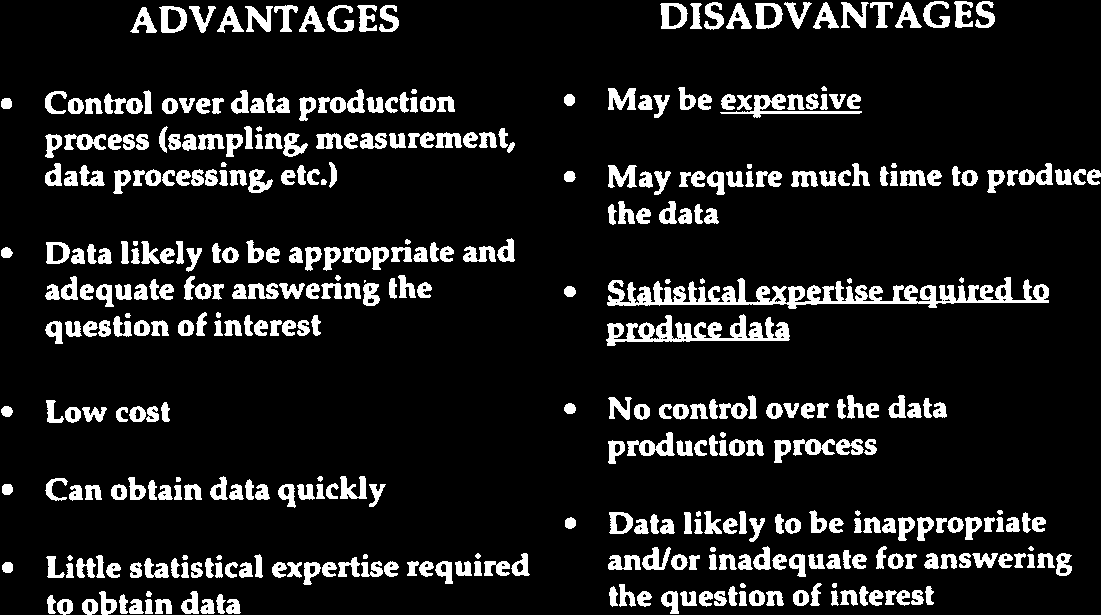
Advantages and Disadvantages of Data Sources
Both primary and secondary data sources have their own advantages and disadvantages, which must be considered when designing a study.
Advantages | Disadvantages |
|---|---|
|
|
Measurement and the Measurement Process
Definition and Components of Measurement
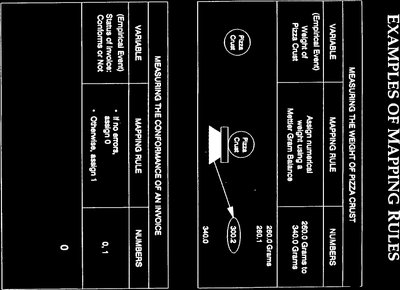
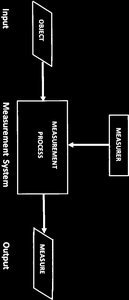
Measurement is the process by which numbers are assigned to phenomena occurring in the real world. The goal is to translate characteristics and properties of real-world phenomena into a form that can be analyzed.
Empirical Events: Observable characteristics of an object, individual, or organization.
Numbers: Numerals or symbols used to identify or designate empirical events.
Mapping Rules: Statements that dictate the assignment of numbers to empirical events.
Steps in the Measurement Process
The measurement process involves several key steps to ensure that the data collected is valid and reliable.
Identify the variable of interest and develop a conceptual definition for the variable.
Develop an operational definition for the variable.
Develop or obtain a measurement instrument.
Evaluate the measurement instrument according to validity, reliability, and practicality.


Conceptual vs. Operational Definitions
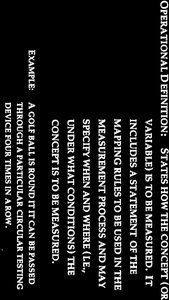
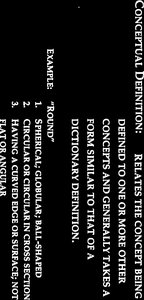
Conceptual definitions relate the concept being defined to one or more other concepts, often resembling a dictionary definition. Operational definitions specify the procedures for assigning numbers to the concept being measured, including what is to be observed, under what conditions, and with what instruments.
Example (Conceptual): "Round" defined as spherical, globular, or ball-shaped.
Example (Operational): A golf ball is round if it can be passed through a particular circular testing device four times in a row.


Evaluating Measurement Procedures
Accuracy in Measurement
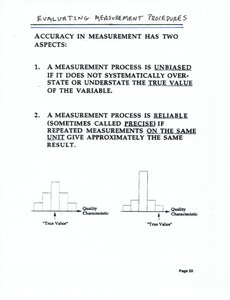
Accuracy in measurement has two aspects: unbiasedness and reliability. An unbiased measurement process does not systematically overstate or understate the true value of the variable. Reliability (or precision) means that repeated measurements on the same unit give approximately the same result.
Unbiased: Measurements are centered around the true value.
Reliable: Measurements are consistent across repeated trials.


Concepts Used in Evaluation of Measurement Instruments
Measurement instruments are evaluated based on several criteria:
Validity: The extent to which an instrument measures what it claims to measure.
Reliability: The extent to which an instrument produces consistent results over time.
Practicality: The extent to which an instrument is economical, convenient, and interpretable.
Sensitivity: The extent to which an instrument discriminates along the dimension of concern.
Influentiality: The extent to which the information provided is influential.


Errors in Data
Sources of Measurement Error
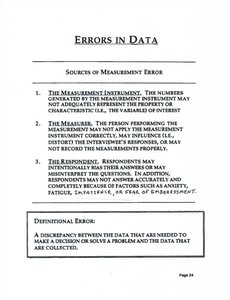
Measurement errors can arise from various sources, affecting the quality and reliability of data.
Measurement Instrument: May not adequately represent the property or characteristic of interest.
Measurer: May not apply the measurement instrument correctly or may record measurements improperly.
Respondent: May misinterpret questions or provide inaccurate answers due to various factors (e.g., fatigue, embarrassment).
Definitional Error: A discrepancy between the data needed to make a decision and the data collected.

Methods for Describing Sets of Data: Measurement Scales
Types of Measurement Scales
The scale of measurement determines the kind of information a number reflects and what statistical operations are permissible.
Nominal Scale: Numbers are used only to classify items into categories. Arithmetic is not meaningful.
Ordinal Scale: Numbers indicate order but not the magnitude of difference between items. Arithmetic is not meaningful, but ranking is.
Interval Scale: Numbers indicate both order and equal intervals between measurements, but there is no true zero point. Addition and subtraction are meaningful.
Ratio Scale: Numbers indicate order, equal intervals, and a true zero point. All arithmetic operations are meaningful.


Examples and Applications
Examples help clarify the differences between measurement scales:
Nominal: Defective = 1, Nondefective = 0
Ordinal: Ranking of sensory inspectors (e.g., 1 = Bob, 2 = Sue, 3 = Steve, 4 = John)
Interval: Temperature in Fahrenheit (e.g., 80°F is not twice as hot as 40°F)
Ratio: Weight, height, income (e.g., $100 is twice as much as $50)
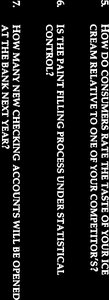
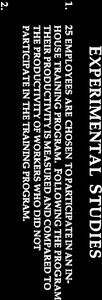
Design of Experiments and Data Collection Techniques
Experimental vs. Observational Studies
Data collection in business statistics can be performed through experimental or observational studies, each with distinct characteristics.
Experimental Study: The analyst manipulates or changes certain independent variables to obtain information about their influence on dependent variables.
Observational Study: The analyst measures the variable of interest for the units under study without disturbing them.


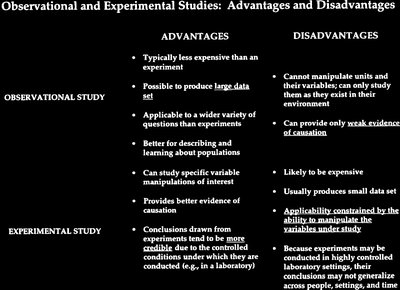
Advantages and Disadvantages of Study Types
Observational Study | Experimental Study |
|---|---|
|
|

Data Collection Techniques
Common techniques for collecting data include interrogation (personal interview, self-enumeration) and observation.
Personal Interview: Analyst obtains data by asking individuals involved in the phenomenon.
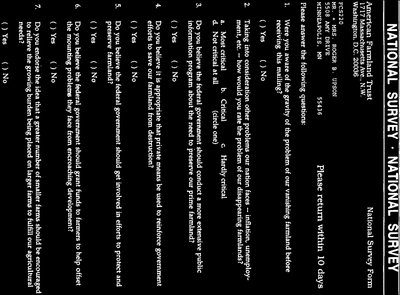
Self-Enumeration: Individuals respond to questionnaires without analyst present.
Observation: Analyst or machine observes the phenomenon and records data.


Summary Table: Measurement Scales
Scale | Information Provided | Examples | Permissible Operations |
|---|---|---|---|
Nominal | Classification only | Defective/Nondefective | Counting, mode |
Ordinal | Order/ranking | Ranking inspectors | Median, percentiles |
Interval | Order, equal intervals | Temperature (°F) | Addition, subtraction |
Ratio | Order, equal intervals, true zero | Weight, income | All arithmetic operations |
