 Back
BackBusiness Statistics Study Guide: Chapters 1–4 (MAT 137)
Study Guide - Smart Notes
 Tailored notes based on your materials, expanded with key definitions, examples, and context.
Provided Formulas
Key Statistical Formulas
Understanding and applying statistical formulas is essential for analyzing data in business statistics. Below are the main formulas you need to know for Test 1:
Sample Variance: Measures the average squared deviation from the mean in a sample.
Expected Value (Discrete Random Variable): The mean value expected from a probability distribution.
Variance (Discrete Random Variable): Measures the spread of a probability distribution.
Chapter 1: Statistics, Data, and Statistical Thinking
Descriptive vs. Inferential Statistics
Statistics is divided into two main branches: descriptive and inferential statistics.
Descriptive Statistics: Uses numerical and graphical methods to summarize and present information from a data set.
Inferential Statistics: Uses sample data to make estimates, predictions, or generalizations about a population.
Key Definitions
Experimental Unit: The object or entity being studied.
Population: The complete set of units under investigation.
Variable: A characteristic or property measured or observed.
Sample: A subset of the population selected for analysis.
Types of Data
Quantitative Data: Numerical values (e.g., income, age).
Qualitative Data: Non-numerical categories (e.g., political party, breed).
Chapter 2: Methods for Describing Sets of Data
Frequency Distributions and Histograms
Frequency distributions and histograms are used to organize and visualize data.
Class: Categories for qualitative data or intervals for quantitative data.
Class Frequency: Number of observations in a class.
Class Relative Frequency: Class frequency divided by total observations.
Class Percentage: Relative frequency multiplied by 100.
Measures of Central Tendency
Mean: Arithmetic average of a data set.
Median: Middle value when data is ordered.
Skewness and Symmetry
Skewed Right: Mean > Median
Skewed Left: Mean < Median
Symmetrical: Mean = Median
Range, Variance, and Standard Deviation
Range: Difference between largest and smallest values.
Sample Variance: Measures variability in a sample.
Sample Standard Deviation: Positive square root of sample variance.
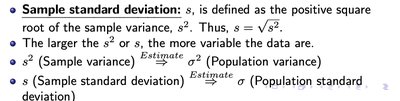
The larger the variance or standard deviation, the more variable the data are. Sample statistics (s, s²) are used to estimate population parameters (σ, σ²).
Empirical Rule
68% of data falls within 1 standard deviation of the mean.
95% within 2 standard deviations.
99.7% within 3 standard deviations.
Z-Scores
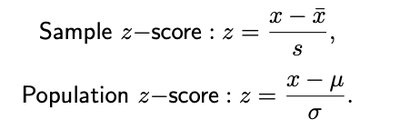
Z-scores measure how many standard deviations a value is from the mean.
Sample z-score:
Population z-score:
Percentiles
The pth percentile is the value below which p% of the data falls.
Example: 90th percentile means 90% of data is below that value.
Chapter 3: Probability
Basic Probability Concepts
Probability quantifies the likelihood of events occurring in an experiment.
Probability: A number between 0 and 1 representing the chance of an event.
Experiment: A process that leads to a single, unpredictable outcome.
Sample Point: The most basic outcome of an experiment.
Sample Space: The set of all possible sample points.
Event: A specific collection of sample points.
Probability Rules
All sample point probabilities must be between 0 and 1.
The sum of all sample point probabilities in a sample space must equal 1.
Finding Probabilities
Probability of an event is its relative frequency in repeated experiments.
Example: Flipping a fair coin, probability of heads = 0.5.
Set Operations and Complements
The probability of complementary events sums to 1.
Chapter 4: Random Variables and Probability Distributions
Random Variables
A random variable assigns numerical values to outcomes of an experiment.
Discrete Random Variable: Takes countable values.
Continuous Random Variable: Takes values in intervals (uncountable).
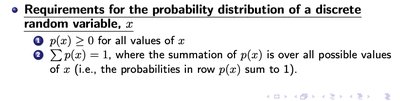
Probability Distribution Requirements
for all values of x
(sum over all possible values of x)
Expected Value and Variance
Expected Value (Mean):
Variance:
Binomial Distribution
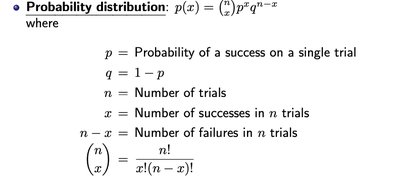
The binomial distribution models the number of successes in a fixed number of independent trials, each with the same probability of success.
Characteristics:
n identical trials
Two possible outcomes per trial: success (S) or failure (F)
Probability of success (p) remains constant
Trials are independent
Probability Distribution Formula: where , = number of trials, = number of successes,
Mean, Variance, and Standard Deviation of Binomial Distribution
Mean:
Variance:
Standard Deviation:
Excel Functions for Binomial Distribution
BINOM.DIST Function
BINOM.DIST(a, n, p, TRUE): Computes cumulative probability of up to a successes in n trials.
BINOM.DIST(a, n, p, FALSE): Computes probability of exactly a successes in n trials.
Arguments:
a: Number of successes
n: Number of trials
p: Probability of success
