 Back
BackChapter 1: An Introduction to Business Statistics – Study Notes
Study Guide - Smart Notes
 Tailored notes based on your materials, expanded with key definitions, examples, and context.
1.1 Business Statistics and Their Uses
Definition and Importance
Business statistics is the mathematical science concerned with the collection, analysis, and presentation of data, which forms the basis for inference and decision-making in organizations.
Marketing Research: Uses focus group data and customer surveys to understand consumer preferences.
Advertising: Relies on household surveys and TV viewing habits to target audiences.
Operations: Applies quality control and reliability data to improve processes.
Finance: Analyzes data on income, credit risk, and unemployment for financial planning.
Weather: Uses forecasting data for planning and risk minimization.
1.2 Data
Definition and Types
Data are values assigned to observations or measurements. When data are processed and interpreted, they become information—useful facts for decision-making.
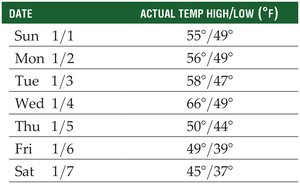
Raw Data: Unprocessed facts or measurements (e.g., daily temperatures in NYC).
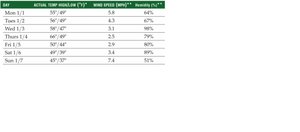
Information: Data that have been analyzed to provide meaning or support decisions.
Data Sets and Databases
Data Set: A collection of related data points.
Database: An organized collection of data sets, typically structured in rows (records) and columns (fields).
Sources of Data
Primary Data: Collected directly by the user for a specific purpose (e.g., surveys, experiments, direct observation).
Secondary Data: Collected by others and used for analysis (e.g., government reports, published studies).
Type | Advantages | Disadvantages |
|---|---|---|
Primary Data | Tailored to specific needs; control over collection | Expensive and time-consuming |
Secondary Data | Readily available; less costly | Less control; may be less reliable |
Primary Data Collection Methods
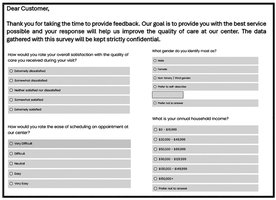
Surveys/Questionnaires: Collect responses to specific questions (e.g., customer satisfaction surveys).
Experiments: Apply treatments in controlled conditions to observe effects (e.g., testing fertilizers on crop growth).
Direct Observation/Focus Groups: Observe subjects in natural settings or group discussions (e.g., observing driver behavior at stop signs).


Example of a Survey

Bias in Data Collection
Bias: Occurs when survey questions or sampling methods influence responses, leading to inaccurate or misleading results.
Example: Leading questions such as “Wouldn’t you agree that all drivers should wear a seat belt?” can bias responses.
Types of Data
Qualitative Data: Classified by descriptive terms (e.g., name, education level).
Quantitative Data: Described by numerical values (e.g., number of customers, weight, height).
Levels of Measurement
Data can be classified by their level of measurement, which determines the types of statistical analysis that are appropriate.
Level | Description | Example |
|---|---|---|
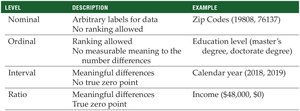
Nominal | Arbitrary labels; no ranking | Zip Codes (19808, 76137) |
Ordinal | Ranking allowed; differences not meaningful | Education level (master’s, doctorate) |
Interval | Meaningful differences; no true zero | Calendar year (2018, 2019) |
Ratio | Meaningful differences; true zero | Income ($48,000, $0) |
Time Series vs. Cross-Sectional Data
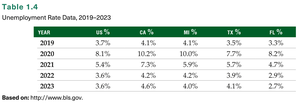
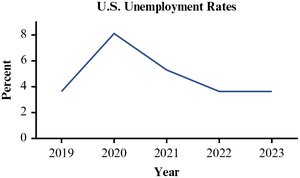
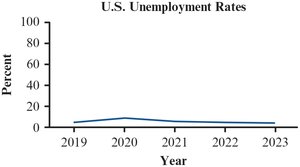
Time Series Data: Values measured at successive points in time (e.g., monthly unemployment rates from 2019–2023).
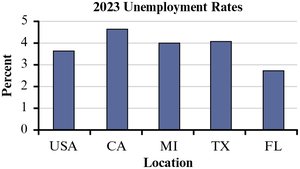
Cross-Sectional Data: Values collected from multiple subjects at a single point in time (e.g., unemployment rates by state in 2023).
Year | US % | CA % | MI % | TX % | FL % |
|---|---|---|---|---|---|
2019 | 3.7 | 4.1 | 4.1 | 3.5 | 3.3 |
2020 | 8.1 | 10.2 | 10.0 | 7.7 | 8.2 |
2021 | 5.4 | 7.3 | 5.9 | 5.7 | 4.7 |
2022 | 3.6 | 4.2 | 4.2 | 3.9 | 2.9 |
2023 | 3.6 | 4.6 | 4.0 | 4.1 | 2.7 |
1.3 Branches of Statistics
Descriptive, Inferential, and Predictive Statistics
Descriptive Statistics: Methods for collecting, summarizing, and displaying data (e.g., charts, tables, averages).
Inferential Statistics: Drawing conclusions about a population based on sample data.
Predictive Statistics: Using past data to forecast future values and support decision-making.
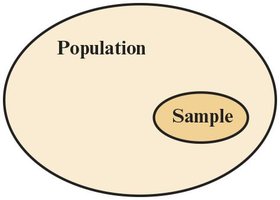
Population vs. Sample
Population: The entire group of subjects of interest in a study.
Sample: A subset of the population, selected to represent the whole.
Parameter vs. Statistic
Parameter: A numerical characteristic describing a population (e.g., population mean μ).
Statistic: A numerical characteristic describing a sample (e.g., sample mean x̄).
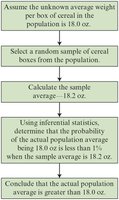
Inferential Statistics Example
Inferential statistics allow us to estimate unknown population parameters based on sample statistics.
Example: Using a sample average to estimate the population average for quality control.
1.4 Ethics and Statistics—It’s a Dangerous World of Data Out There
Bias and Misuse of Statistics
Biased Sample: A sample that does not accurately represent the population, leading to distorted findings.
Sources of Bias: Poor sampling methods, leading questions, or selective data reporting.
Graphical Misrepresentation: Altering graph scales or omitting context can mislead viewers.
Best Practices: Use random sampling and clear, unbiased questions to avoid misleading results.
Additional info: Ethical practice in statistics is essential to ensure that data-driven decisions are valid and trustworthy. Always consider the source, method, and presentation of data when interpreting statistical findings.
