 Back
BackChapter 3: Probability – Foundations and Operations
Study Guide - Smart Notes
 Tailored notes based on your materials, expanded with key definitions, examples, and context.
Probability: Concepts and Foundations
Definition and Importance
Probability is a fundamental concept in statistics, representing a numerical measure (between 0 and 1) of the likelihood that a specific event will occur. Understanding probability is essential for making statistical inferences and assessing the reliability of conclusions drawn from data. Probability theory underpins many statistical methods, including confidence intervals and hypothesis testing.
Probability: A value between 0 and 1 indicating the chance of an event's occurrence.
Application Example: What is the probability that a couple will have a baby girl? Or two girls in a row? Or another girl given two previous girls?
Statistical Inference: Probability is used to quantify reliability, such as confidence levels and significance levels in statistical tests.
Probability Terminologies
Basic Terms and Examples
Probability theory uses specific terminology to describe experiments and their outcomes. Understanding these terms is crucial for analyzing random processes.
Experiment: An act or process of observation leading to a single, unpredictable outcome (e.g., flipping a coin, rolling a die).
Sample Point: The most basic outcome of an experiment, which cannot be further decomposed (e.g., rolling a 3 on a die).
Sample Space (S): The set of all possible sample points for an experiment (e.g., S = {1, 2, 3, 4, 5, 6} for a die roll).
Venn Diagram: A visual representation of the sample space and events, where each sample point is a dot within a closed figure labeled S.
Events: Simple and Compound
An event is a specific collection of sample points. Events can be classified as simple or compound:
Simple Event: Contains only one sample point (e.g., B = {2} when rolling a die).
Compound Event: Contains two or more sample points (e.g., A = {2, 4, 6} for rolling an even number).
Probability Rules for Sample Points
Assigning Probabilities
Probabilities are assigned to sample points based on their relative frequency in repeated experiments. The following rules must be satisfied:
All sample point probabilities must be between 0 and 1:
The sum of all sample point probabilities in the sample space must equal 1:
Example: Flipping a fair coin: (heads), (tails). .
Calculating the Probability of a Compound Event
Steps for Calculation
To determine the probability of a compound event, follow these steps:
Define the experiment and the type of observation.
List all sample points.
Assign probabilities to each sample point.
Identify the sample points included in the event of interest.
Sum the probabilities of these sample points to obtain the event probability.
Example: Rolling a die, the probability of observing an even number (A = {2, 4, 6}) is the sum of the probabilities for 2, 4, and 6.
Application Example: Diversity Training
Consider the following table summarizing the primary reasons businesses use diversity training. If one business is selected at random, the probability of each reason can be interpreted as the percentage divided by 100.
Reason | Percentage |
|---|---|
Comply with personnel policies (CPP) | 7 |
Increase productivity (IP) | 47 |
Stay competitive (SC) | 38 |
Social responsibility (SR) | 4 |
Other (O) | 4 |
Total | 100 |
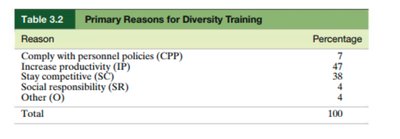
Sample Points: CPP, IP, SC, SR, O
Probability of business-related reason (IP or SC):
Probability that social responsibility is not a primary reason:
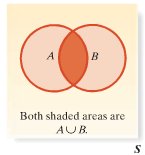
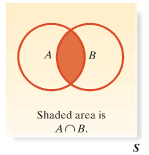
Operations of Events
Union, Intersection, and Complement
Events can be combined or modified using set operations:
Union (A ∪ B): The event that occurs if either A, B, or both occur. contains all sample points in A or B or both.
Intersection (A ∩ B): The event that occurs if both A and B occur. contains all sample points in both A and B.
Complement (Ac or \overline{A}): The event that A does not occur; all sample points not in A.
Example: Die Toss Experiment
Experiment: Toss a die. S = {1, 2, 3, 4, 5, 6}
Event A: Toss an even number (A = {2, 4, 6})
Event B: Toss a number ≤ 3 (B = {1, 2, 3})
Union (A ∪ B): {1, 2, 3, 4, 6}
Intersection (A ∩ B): {2}
Complement (Ac): {1, 3, 5}
Probability Calculations (assuming fair die):
Rule of Complements
The sum of the probabilities of complementary events equals 1:
or, equivalently,
