 Back
BackChapter 4: Introduction to Probabilities – Business Statistics Study Notes
Study Guide - Smart Notes
 Tailored notes based on your materials, expanded with key definitions, examples, and context.
Introduction to Probabilities
What is Probability?
Probability is a numerical measure, ranging from 0 to 1, that quantifies the likelihood of a specific event occurring. A probability of 0 means the event cannot occur, while a probability of 1 means the event is certain to occur.
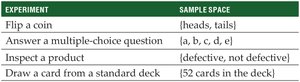
Experiment: The process of measuring or observing an activity to collect data (e.g., rolling a die).
Sample Space: The set of all possible outcomes of an experiment.
Event: One or more outcomes of an experiment (a subset of the sample space).
Simple Event: An event with a single outcome that cannot be decomposed further.
Sample Space Example
For a single six-sided die, the sample space is {1, 2, 3, 4, 5, 6}.

Methods of Assigning Probability
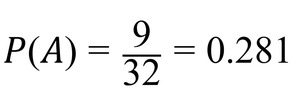
Classical Probability
Used when all possible outcomes are known and equally likely. The probability of an event A is:
Example: Probability of rolling a five with a die:

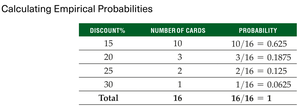
Empirical Probability
Calculated by conducting experiments and observing the frequency of events. The probability of event A is:
Example: Kohl’s discount cards: Out of 16 cards, 10 offer a 15% discount.

Law of Large Numbers
As the number of trials increases, empirical probabilities converge to classical probabilities.
Subjective Probability
Estimated based on intuition, experience, or judgment when classical and empirical methods are not available.
Example: A manager estimates a 75% chance of a hiring freeze next year.
Basic Properties and Rules of Probability
Rule 1: If , event A is certain to occur.
Rule 2: If , event A will not occur.
Rule 3: for any event A.
Rule 4: The sum of probabilities for all simple events in the sample space is 1.
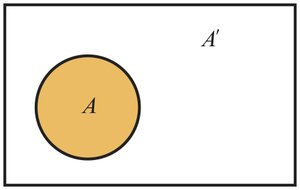
Rule 5 (Complement Rule): The probability of the complement of A (denoted A') is .
Probability Rules for More Than One Event
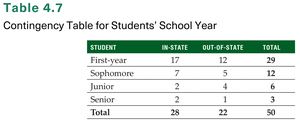
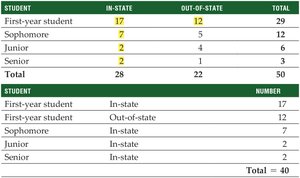
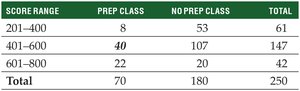
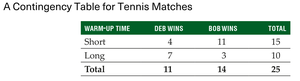
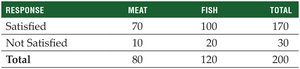
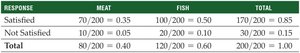
Contingency Tables
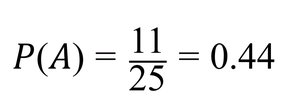
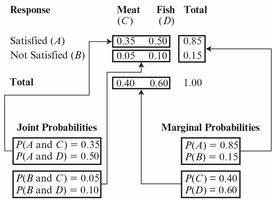
Contingency tables display the frequency of events classified by two categorical variables. Marginal probabilities are found in the margins (totals) of the table.

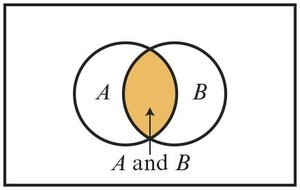
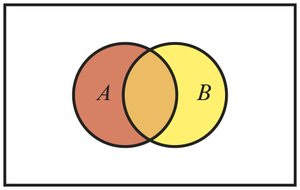
Intersection of Events (Joint Probability)
The intersection of events A and B (A ∩ B) is the probability that both events occur simultaneously.
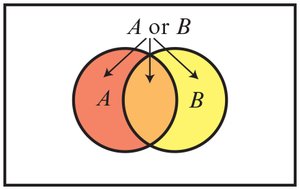
Union of Events
The union of events A and B (A ∪ B) is the probability that at least one of the events occurs.
Addition Rule
For mutually exclusive events (cannot occur together):
For events that are not mutually exclusive:
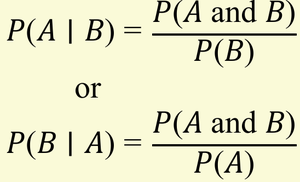
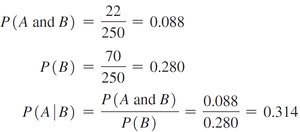
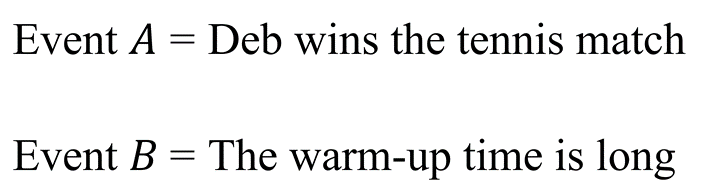
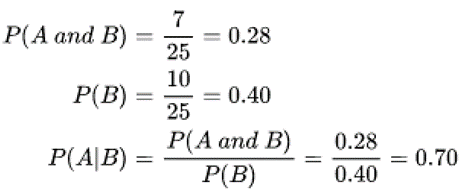
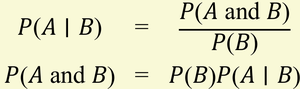
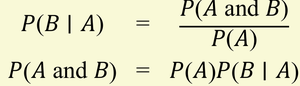
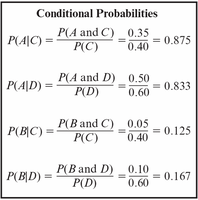
Conditional Probability
Conditional probability is the probability that event A occurs given that event B has occurred. It is calculated as:
Independent and Dependent Events
Two events are independent if the occurrence of one does not affect the probability of the other. Otherwise, they are dependent.
Test for Independence:

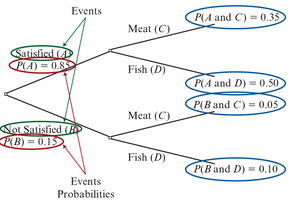
The Multiplication Rule
Used to find the probability of the intersection of two events.
For independent events:
For dependent events:
Contingency Tables with Probabilities
Contingency tables can be converted to probability tables by dividing each frequency by the total number of observations.
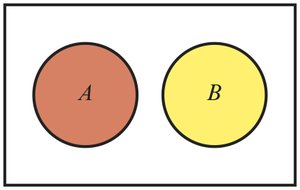
Mutually Exclusive and Independent Events
Mutually Exclusive Events: Cannot occur at the same time (e.g., satisfied and unsatisfied).
Independent Events: The occurrence of one does not affect the other; can occur together.
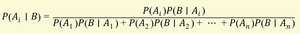
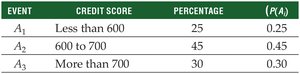
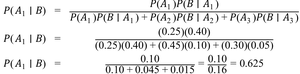
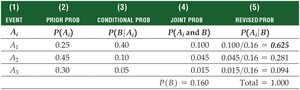
Bayes’ Theorem
Bayes’ Theorem is used to update probabilities based on new information. For n mutually exclusive events :
Counting Principles
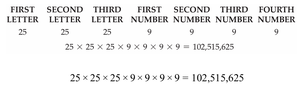
Fundamental Counting Principle
If there are choices for the first event, for the second, ..., for the nth event, the total number of possible outcomes is .
Permutations
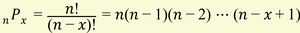
Permutations count the number of ways to arrange objects in order. For n distinct objects:
Permutations of n objects taken x at a time:
Combinations
Combinations count the number of ways to select objects without regard to order. For n objects taken x at a time:
Example: The number of five-card combinations from a deck of 52 cards is .
Additional info: These notes cover the foundational probability concepts essential for business statistics, including probability rules, contingency tables, conditional probability, Bayes’ theorem, and counting principles. All images included directly support the explanation of the adjacent content.
