 Back
BackChapter 8: Confidence Intervals – Business Statistics Study Notes
Study Guide - Smart Notes
 Tailored notes based on your materials, expanded with key definitions, examples, and context.
Confidence Intervals
Introduction to Confidence Intervals
Confidence intervals are a fundamental concept in inferential statistics, providing a range of values within which a population parameter is likely to fall. They are widely used in business statistics to estimate means and proportions based on sample data, accounting for sampling variability.
Point Estimates and Interval Estimates
Point Estimates
Point Estimate: A single value (statistic) that serves as a best guess for an unknown population parameter (e.g., sample mean \( \overline{x} \) for population mean \( \mu \)).
Limitation: Does not provide information about the estimate's accuracy or reliability.
Interval Estimates
Interval Estimate: A range of values, derived from a sample, that is likely to contain the population parameter.
Confidence Interval (CI): The most common type of interval estimate, associated with a confidence level (e.g., 90%, 95%).
Confidence Intervals for the Mean (σ Known)
Assumptions
Sample size n is at least 30 (n ≥ 30), or the population is normally distributed.
Population standard deviation σ is known.
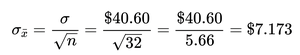
Standard Error of the Mean
The standard error quantifies the variability of the sample mean:
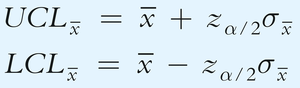
Confidence Interval Formula (σ Known)
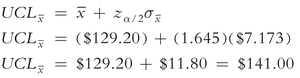
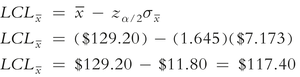
The confidence interval for the mean is given by:
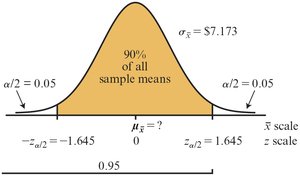
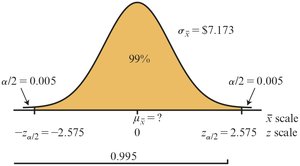
Critical z-Score and Confidence Level
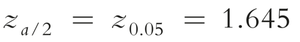
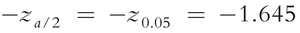
zα/2: The critical value from the standard normal distribution corresponding to the desired confidence level.
For a 90% confidence level, z0.05 = 1.645.
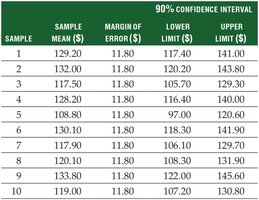
Worked Example: Gap Online Order Size
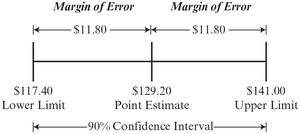
Sample mean: $129.20
Sample size: 32
Population standard deviation: $40.60
Confidence level: 90% (z0.05 = 1.645)
Standard error: $7.173
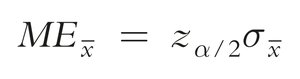
Margin of Error
The margin of error (ME) is the distance from the sample mean to either endpoint of the confidence interval:
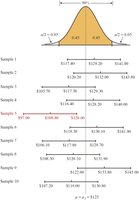
Interpreting Confidence Intervals
A 90% confidence interval means that if we took many samples, about 90% of the intervals would contain the true population mean.
It does not mean there is a 90% probability that the population mean is in the calculated interval for a single sample.
Changing Confidence Levels
Increasing the confidence level (e.g., from 90% to 99%) makes the interval wider, reflecting greater certainty.
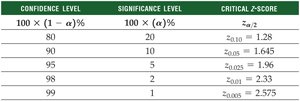
Common critical z-scores:
Confidence Level | Significance Level | Critical z-Score |
|---|---|---|
80% | 20% | 1.28 |
90% | 10% | 1.645 |
95% | 5% | 1.96 |
98% | 2% | 2.33 |
99% | 1% | 2.575 |
Confidence Intervals for the Mean (σ Unknown)
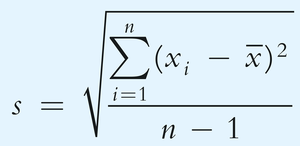
Sample Standard Deviation and t-Distribution
When σ is unknown, use the sample standard deviation s:
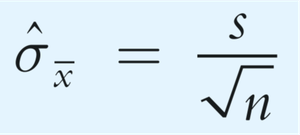
The standard error is estimated as:
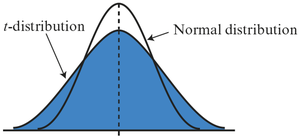
Use the Student's t-distribution, which is wider and flatter than the normal distribution, especially for small samples.
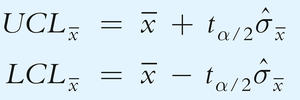
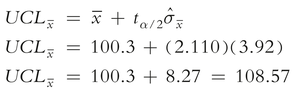
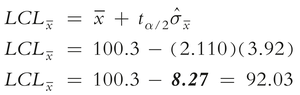
Confidence Interval Formula (σ Unknown)
The confidence interval is:
Worked Example: Chiropractor's Weekly Patients
Sample mean: 100.3
Sample size: 18
Sample standard deviation: 16.6
Confidence level: 95% (t0.025 = 2.110)
Standard error: 3.92
Confidence Intervals for Proportions
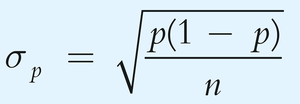
Standard Error and Confidence Interval for Proportions
For a population proportion p:
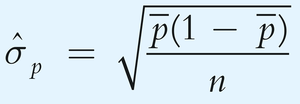
When p is unknown, use the sample proportion \( \overline{p} \):
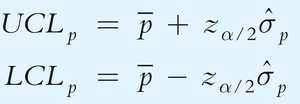
Confidence interval for a proportion:
Margin of error for a proportion:

Determining the Sample Size
Sample Size for Estimating a Mean
To achieve a desired margin of error, solve for n:
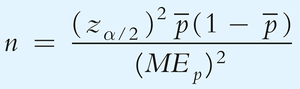
Sample Size for Estimating a Proportion
To achieve a desired margin of error for a proportion:
Confidence Intervals for Finite Populations
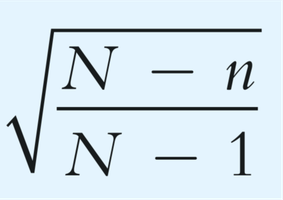
Finite Population Correction Factor
When sampling from a finite population, adjust the standard error:
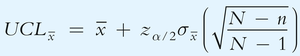
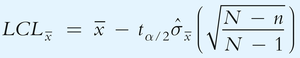
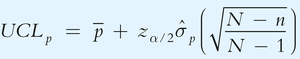
Confidence Interval Formulas with Finite Population Correction
For the mean (σ known):
For the mean (σ unknown):
For a proportion:
Applications and Interpretation
Confidence intervals are used in business to interpret survey results, estimate means and proportions, and make data-driven decisions.
Margin of error and confidence level should always be reported to convey the reliability of estimates.
Additional info: The notes above include all major formulas, definitions, and examples relevant to constructing and interpreting confidence intervals for means and proportions, including finite population corrections, as covered in a typical business statistics course.
