 Back
BackComparing Two Groups: Means and Proportions in Business Statistics
Study Guide - Smart Notes
 Tailored notes based on your materials, expanded with key definitions, examples, and context.
Comparing Two Groups in Business Statistics
Introduction
In business statistics, comparing two groups is a fundamental task for making data-driven decisions. This process often involves comparing means or proportions between two populations, using either paired or independent samples. The correct statistical method depends on the type of data, the sampling design, and assumptions about population variances.
Types of Comparisons
Paired vs. Independent Samples
Understanding whether your samples are paired or independent is crucial for selecting the appropriate statistical test.
Paired Samples: Each observation in one sample is uniquely matched to an observation in the other sample (e.g., before-and-after measurements on the same subjects).
Independent Samples: Observations in one sample are unrelated to those in the other sample (e.g., comparing two different groups).
Quantitative vs. Categorical Data
Quantitative Data: Use means and standard deviations to compare groups.
Categorical Data: Use proportions to compare groups.
Statistical Methods for Comparing Two Groups
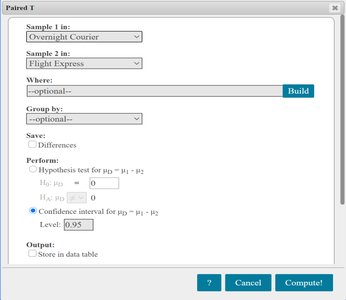
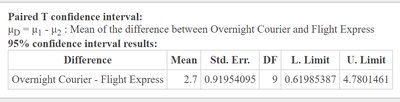
Paired t-Test
The paired t-test is used when comparing the means of two related groups. The test statistic is based on the differences between paired observations.
Null Hypothesis (H0): (no difference in means)
Test Statistic:
Confidence Interval:
Example: Comparing delivery times for two courier services using paired data from the same offices.
Independent Samples t-Test
Used to compare the means of two independent groups. The method depends on whether population variances are assumed equal or unequal.
Equal Variances (Pooled):
Test Statistic:
Pooled Variance:
Degrees of Freedom:
Unequal Variances (Satterthwaite):
Test Statistic:
Degrees of Freedom (approximate):
Example: Comparing the mean driving distance of two brands of golf balls using independent samples.


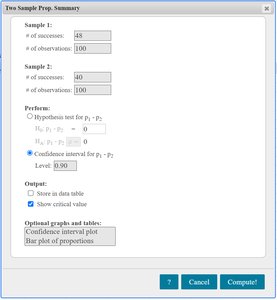
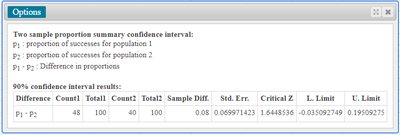
Comparing Two Proportions
When comparing categorical outcomes between two independent groups, use the difference in sample proportions.
Confidence Interval:
Assumptions: Each sample is a simple random sample (SRS), and sample sizes are large enough for the normal approximation to be valid.
Example: Comparing the proportion of successes in two independent samples.
Choosing the Right Method: Decision Flowchart
Selecting the correct statistical test depends on the type of data, number of groups, and assumptions about variances. The following flowchart summarizes the decision process:

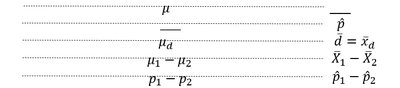
Summary Table: Key Parameters and Statistics
Parameter | Statistic |
|---|---|
Population Mean () | Sample Mean () |
Mean Difference (Paired) () | Sample Mean Difference () |
Difference in Means () | |
Difference in Proportions () |
Interpretation of Confidence Intervals
If the confidence interval for a difference includes zero, there is no statistically significant difference.
If the interval is entirely above or below zero, it indicates a statistically significant difference in the direction of the interval.
Summary
Always verify the independence of samples and the type of data before selecting a test.
Use paired t-tests for matched samples and independent t-tests for unrelated groups.
For proportions, use the two-sample z-interval for large samples.
Check assumptions about normality and variance equality for valid inference.
