Back
Data Types, Graphs, Charts, and Tables—Describing Your Data
Study Guide - Learn with Videos
 Curated lessons matched to your uploaded material – learn every topic step by step.
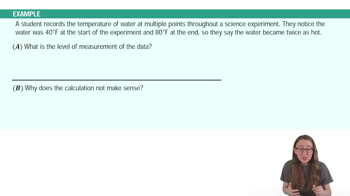
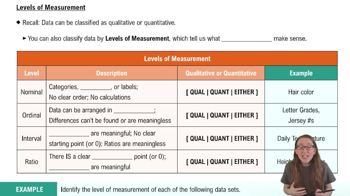
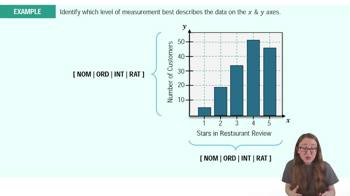
Levels of Measurement
- Guided course
 02:46

- Guided course 06:52
- Guided course 02:46
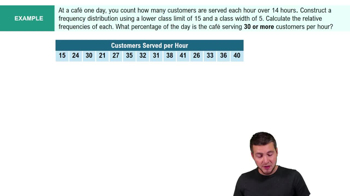
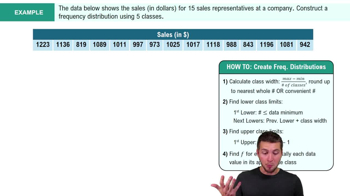
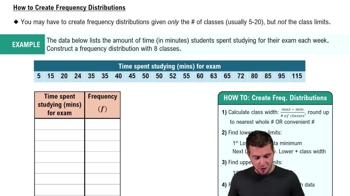
Frequency Distributions
- Guided course 06:19
- Guided course 05:18
- Guided course 06:29
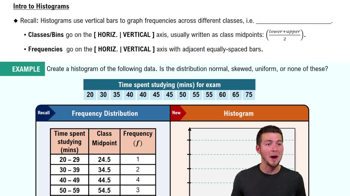
Histograms
- Guided course 05:54
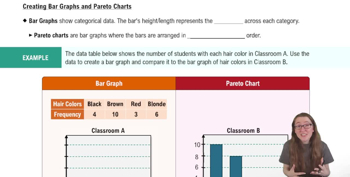
Bar Graphs and Pareto Charts
- Guided course 04:52
- Guided course 05:26
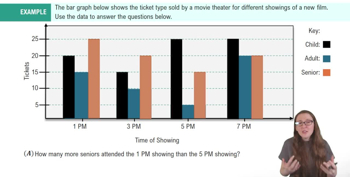
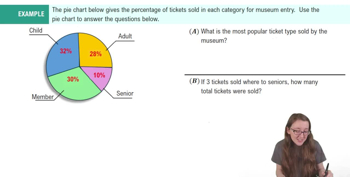
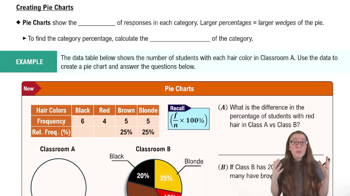
Pie Charts
- Guided course 01:18
- Guided course 06:10
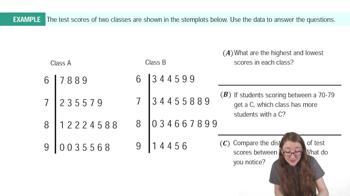
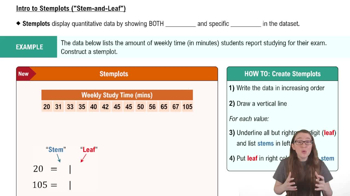
Stemplots (Stem-and-Leaf Plots)
- Guided course 06:09
- Guided course 06:23
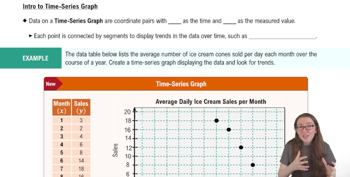
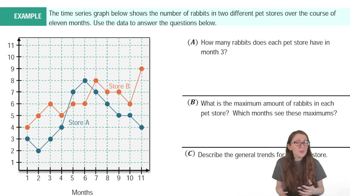
Time-Series Graph
- Guided course 04:13
- Guided course 04:36
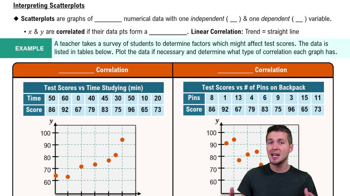
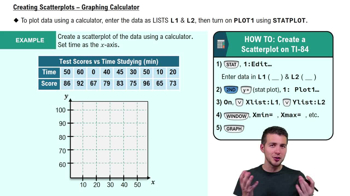
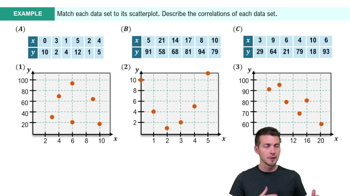
Scatterplots & Intro to Correlation
- Guided course 06:36
- Guided course 05:26
- Guided course 05:14