 Back
BackDefining and Collecting Data: Business Statistics Chapter 1 Study Notes
Study Guide - Smart Notes
 Tailored notes based on your materials, expanded with key definitions, examples, and context.
Defining and Collecting Data
Introduction
This chapter introduces foundational concepts in business statistics, focusing on how to define variables, understand measurement scales, collect data, and address issues in data preparation and survey errors. Mastery of these topics is essential for effective statistical analysis and interpretation in business contexts.
Classifying Variables
Types of Variables
Variables are characteristics or properties that can take different values. They are classified as follows:
Categorical (Qualitative) Variables: Represent categories or groups, such as "yes/no" or "blue/brown/green".
Numerical (Quantitative) Variables: Represent measured or counted quantities.
Discrete Variables: Arise from a counting process (e.g., number of children).
Continuous Variables: Arise from a measuring process (e.g., weight, voltage).
Example: Eye color is a categorical variable; number of defects per hour is a discrete numerical variable; weight is a continuous numerical variable.
Measurement Scales
Types of Measurement Scales
Measurement scales determine how variables are categorized and interpreted:
Nominal Scale: Classifies data into distinct categories without implied ranking (e.g., cellular provider: AT&T, Sprint, Verizon).
Ordinal Scale: Classifies data into ordered categories (e.g., ratings: good, better, best).
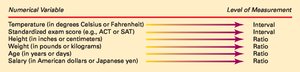
Interval Scale: Ordered scale with meaningful differences between measurements, but no true zero point (e.g., temperature in Celsius).
Ratio Scale: Ordered scale with meaningful differences and a true zero point (e.g., weight, salary).
Example: Age measured in years is a ratio scale; standardized exam scores are interval scales.
Data Collection
Population vs. Sample
Data can be collected from:
Population: All items or individuals of interest.
Sample: A subset of the population, used when collecting data from the entire population is impractical.
Example: A population of 40 individuals; a sample of 4 selected from that population.
Parameter vs. Statistic
Parameter: Summarizes a variable for the entire population.
Statistic: Summarizes a variable for a sample.
Sources of Data
Ongoing Business Activities: E.g., banks analyzing transaction data for fraud detection.
Distributed Data: E.g., financial data from investment services.
Survey Data: E.g., political polls, product satisfaction surveys.
Designed Experiments: E.g., consumer testing of products.
Observational Studies: E.g., measuring customer service times.
Primary vs. Secondary Data Sources
Primary: Data collected and analyzed by the same person or organization.
Secondary: Data analyzed by someone other than the collector (e.g., census data).
Sampling Methods
Sampling Frame
The sampling frame is a list of items that make up the population. Inaccurate frames can lead to biased results.
Types of Samples
Nonprobability Samples: Items are chosen without regard to probability.
Convenience Sampling: Based on ease of access.
Judgment Sampling: Based on expert opinion.
Probability Samples: Items are chosen based on known probabilities.
Simple Random Sample: Every item has an equal chance of selection.
Systematic Sample: Select every kth item after a random start.
Stratified Sample: Divide population into strata and sample proportionally.
Cluster Sample: Divide population into clusters, randomly select clusters, and sample within them.
Comparing Sampling Methods
Simple Random & Systematic: Easy to use, may not represent all characteristics.
Stratified: Ensures representation across subgroups.
Cluster: Cost-effective, but less efficient.
Data Preparation and Cleaning
Data Cleaning
Data cleaning corrects irregularities such as invalid values, coding errors, and integration errors. It is a crucial preprocessing step before analysis.
Invalid Variable Values: Non-numeric entries for numerical variables, values outside defined ranges.
Coding Errors: Inconsistent or incorrect categorical values, extraneous characters.
Data Integration Errors: Redundant columns, duplicated rows, differing units.
Data cleaning can be semi-automated using software tools, but manual review is often necessary. Always preserve the original data.
Stacked vs. Unstacked Data
Unstacked Data: Separate variables for different groups.
Stacked Data: Single column for variable of interest, additional columns for grouping variables.
Recoding Variables
Recoding involves redefining categories or converting numerical variables to categorical. New categories must be mutually exclusive and collectively exhaustive.
Survey Errors and Ethical Issues
Types of Survey Errors
Coverage Error: Some groups excluded from the frame.
Nonresponse Error: Differences between respondents and nonrespondents.
Sampling Error: Random variation between samples.
Measurement Error: Poor question design or respondent mistakes.
Ethical Issues
Survey designers may intentionally bias results through coverage or nonresponse errors.
Failure to report sampling error margins is unethical.
Leading questions or interviewer bias can distort results.
Respondents may provide false information.
Summary Table: Types of Variables and Measurement Scales
Variable Type | Examples | Measurement Scale |
|---|---|---|
Categorical | Marital Status, Political Party, Eye Color | Nominal, Ordinal |
Numerical (Discrete) | Number of Children, Defects per hour | Ratio |
Numerical (Continuous) | Weight, Voltage | Ratio |
Ordinal | Ratings: Good, Better, Best; Low, Med, High | Ordinal |
Key Formulas
Sample Mean
The sample mean is calculated as:
Population Mean
The population mean is calculated as:
Sampling Interval (Systematic Sampling)
For systematic sampling:
Where N is the population size and n is the sample size.
Chapter Summary
This chapter covered the definition and classification of variables, measurement scales, data collection methods, sampling techniques, data preparation, survey errors, and ethical issues. Understanding these concepts is fundamental for conducting reliable and valid statistical analyses in business.
