Back

Describing Data: Tables, Graphs, and Numerical Measures in Business Statistics

Study Guide - Learn with Videos

Curated lessons matched to your uploaded material – learn every topic step by step.

Bar Graphs and Pareto Charts

  • Guided course
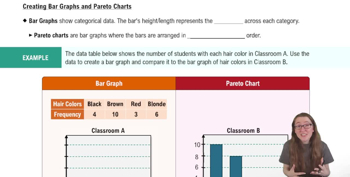
    Creating Bar Graphs and Pareto Charts
    04:52
  • Guided course
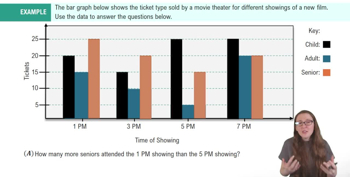
    Example 1
    05:26

Pie Charts

  • Guided course
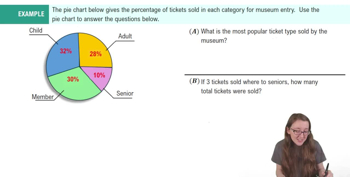
    Example 1
    01:18
  • Guided course
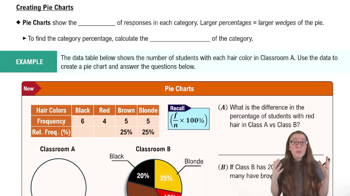
    Creating Pie Charts
    06:10

Dot Plots

  • Guided course
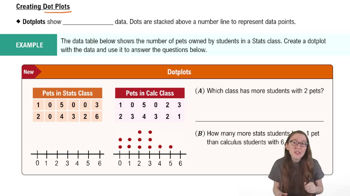
    Creating Dotplots
    04:01

Histograms

  • Guided course
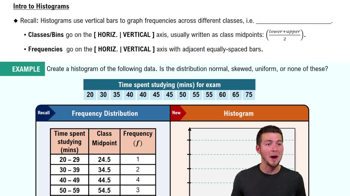
    Intro to Histograms
    05:54

Mean

  • Guided course
     Calculating the Mean Example 1
    03:08
  • Guided course
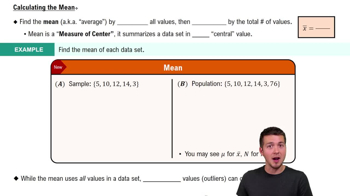
    Calculating the Mean
    04:52

Median

  • Guided course
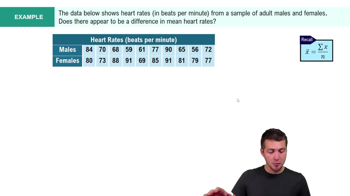
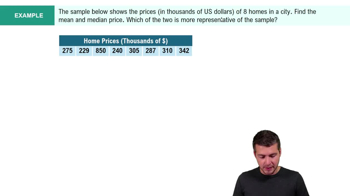
    Comparing Mean vs. Median Example 2
    04:56
  • Guided course
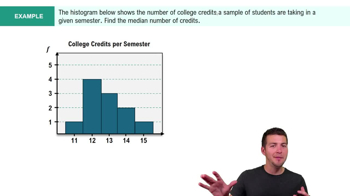
    Calculating the Median Example 1
    02:35
  • Guided course
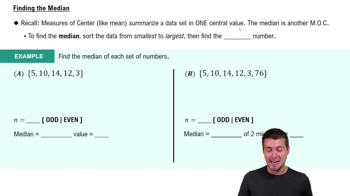
    Calculating the Median
    03:26

Mode

  • Guided course
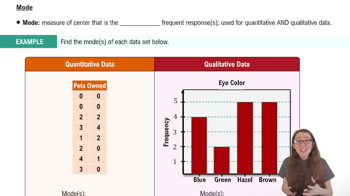
    Mode
    03:20

Standard Deviation

  • Guided course
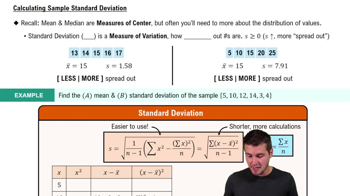
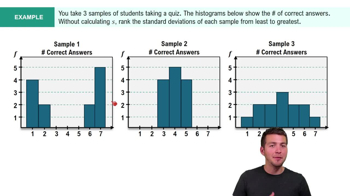
    Calculating Standard Deviation
    08:45
  • Guided course
    Calculating Standard Deviation Example 1
    02:59

Interpreting Standard Deviation

  • Guided course
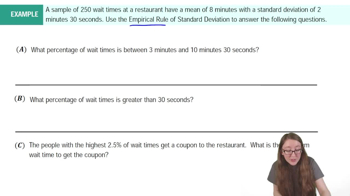
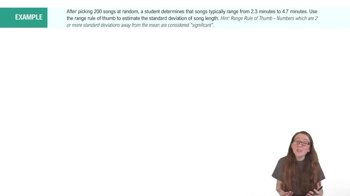
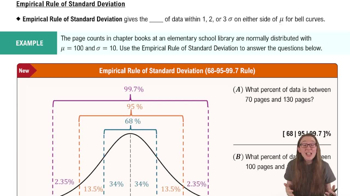
    Empirical Rule of Standard Deviation and Range Rule of Thumb Example 1
    05:42
  • Guided course
    Empirical Rule of Standard Deviation and Range Rule of Thumb Example 2
    01:56
  • Guided course
    Empirical Rule of Standard Deviation and Range Rule of Thumb
    07:10

Percentiles & Quartiles

  • Guided course
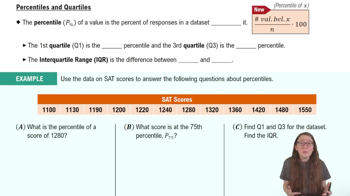
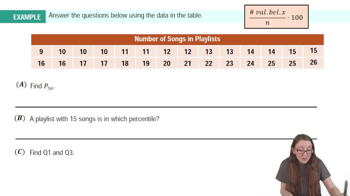
    Percentiles and Quartiles
    07:11
  • Guided course
    Percentiles and Quartiles Example 1
    04:30

Boxplots

  • Guided course
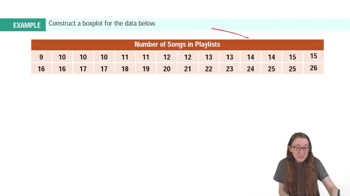
    Boxplots Example 1
    01:52
  • Guided course
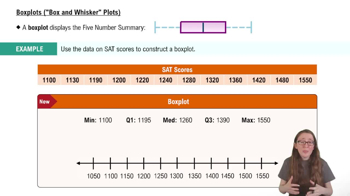
    Boxplots ("Box and Whisker Plots")
    03:54
  • Guided course
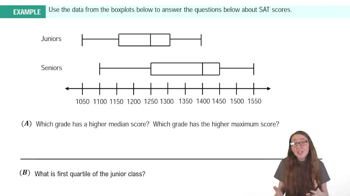
    Boxplots Example 2
    02:48

Scatterplots & Intro to Correlation

  • Guided course
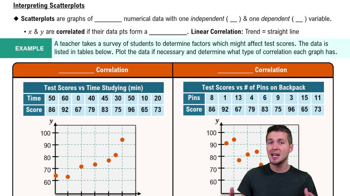
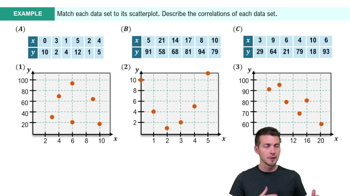
    Scatterplots & Intro to Correlation
    06:36
  • Guided course
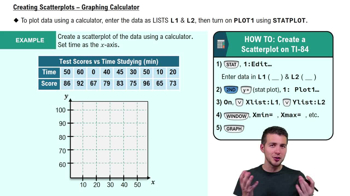
    Creating Scatterplots - Graphing Calculator
    05:26
  • Guided course
    Scatterplots & Intro to Correlation Example 1
    05:14

Time-Series Graph

  • Guided course
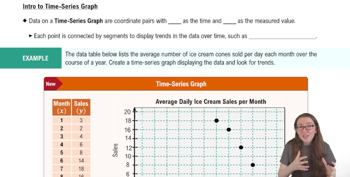
    Creating Time-Series Graphs
    04:13
  • Guided course
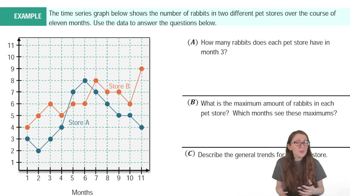
    Example 1
    04:36