 Back
BackDescriptive Statistics: Measures of Central Tendency, Variability, and Association
Study Guide - Smart Notes
 Tailored notes based on your materials, expanded with key definitions, examples, and context.
Calculating Descriptive Statistics
Statistics vs. Parameters
In business statistics, it is important to distinguish between statistics and parameters. Statistics are measures computed from sample data, while parameters are measures computed from population data. In practice, business analysts typically use sample statistics to make inferences about population parameters, since full population data is rarely available.
Measures of Central Tendency
Mean, Median, Mode, and Weighted Mean
Measures of central tendency summarize the center point of a data set. The most common measures are:
Mean: The arithmetic average of the data values.
Median: The middle value when data is arranged in order.
Mode: The value that appears most frequently.
Weighted Mean: The mean where some values are given more importance (weight).
The Mean
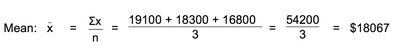
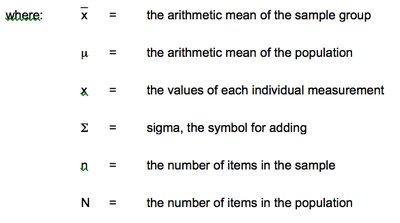
The mean is calculated by summing all values and dividing by the number of observations.
Sample Mean Formula:
Population Mean Formula:
Example: Find the mean salary of three employees: $19,100, $18,300, $16,800.
The Weighted Mean
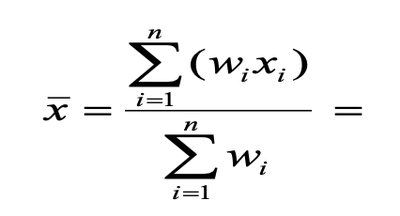
The weighted mean assigns different weights to values, reflecting their relative importance.
Weighted Mean Formula:
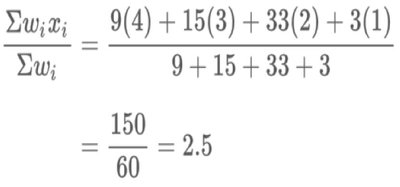
Example: Calculating GPA with credit hours as weights:
Advantages and Disadvantages of the Mean
Advantages: Simple to calculate; summarizes data with a single value.
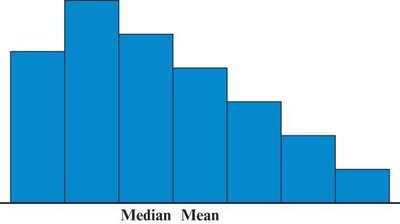
Disadvantages: Sensitive to outliers; does not reveal the shape or spread of the data.
The Median
The median is the value for which half the observations are higher and half are lower. It is less sensitive to outliers than the mean.
Index Point Formula:
If the index is not a whole number, round up to the next whole number.
Example: For data set 21, 27, 27, 28, 34, 45, 50, the median is 28.
Application: Real estate uses median home prices to avoid skew from extreme values.
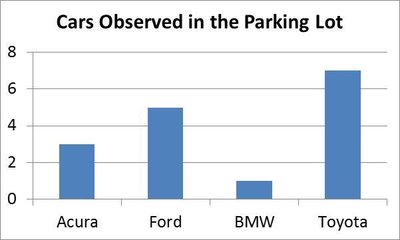
The Mode
The mode is the value that appears most often. It is especially useful for categorical data.
Example: Car model frequency in a parking lot:
Review Example
For house prices: $100,000, $500,000, $100,000, $2,000,000, $300,000:
Mean: $600,000
Median: $300,000
Mode: $100,000
Measures of Variability
Range, Variance, and Standard Deviation
Measures of variability describe the spread of data values.
Range: Difference between the largest and smallest values.
Variance: Average squared deviation from the mean.
Standard Deviation: Square root of the variance; measures average distance from the mean.
Range
Range is easy to calculate but sensitive to outliers.
Standard Deviation & Variance
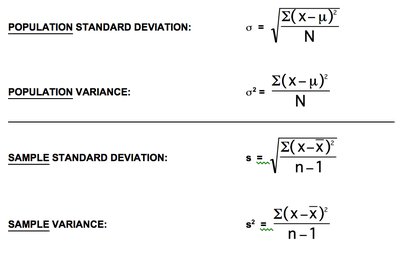
Standard deviation and variance are more robust measures of spread. They are calculated differently for samples and populations.
Sample Variance:
Sample Standard Deviation:
Population Variance:
Population Standard Deviation:
Calculation Example: River Depths
Comparing two rivers with the same mean depth but different variability illustrates why measures of spread are important.
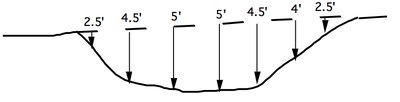
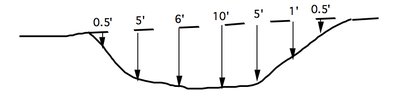
Sample variance and standard deviation calculations:

Coefficient of Variation
Relative Variability
The coefficient of variation (CV) expresses the standard deviation as a percentage of the mean, allowing comparison of variability across different scales.
Sample CV:
Population CV:
Example: Comparing two stocks:
Stock A: CV = 8%
Stock B: CV = 5% (more consistent price)
z-Score
Standardized Values
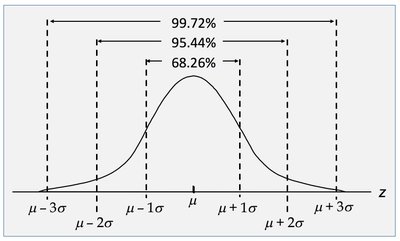
The z-score measures how many standard deviations a value is from the mean. It is used to identify outliers and compare values across distributions.
Population z-score:
Sample z-score:
Percentiles and Quartiles
Percentiles
Percentiles indicate the percentage of values below a given value. The pth percentile is the value below which p% of the data falls.
Index Point Formula:
Quartiles
Quartiles divide data into four equal parts:
Q1: 25th percentile
Q2: 50th percentile (median)
Q3: 75th percentile
Interquartile Range & Outliers
The interquartile range (IQR) is Q3 - Q1 and describes the middle 50% of the data. Outliers are values outside the range:
Upper Limit: Q3 + 1.5(IQR)
Lower Limit: Q1 - 1.5(IQR)
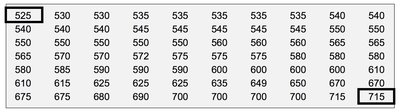
Five-Number Summary
The five-number summary includes: minimum, Q1, median (Q2), Q3, and maximum.
Measures of Association Between Two Variables
Covariance and Correlation
Covariance and correlation measure the linear relationship between two variables.
Sample Covariance:
Sample Correlation Coefficient:
Correlation values range from -1 (perfect negative) to +1 (perfect positive), with 0 indicating no linear relationship.
Summary Table: Measures of Central Tendency and Variability
Measure | Definition | Formula |
|---|---|---|
Mean | Average value | |
Median | Middle value | Position: |
Mode | Most frequent value | N/A |
Range | Difference between max and min | Range = Max - Min |
Variance | Average squared deviation | |
Standard Deviation | Square root of variance | |
Coefficient of Variation | Relative variability | |
z-Score | Standardized value | |
Covariance | Linear relationship direction | |
Correlation | Strength and direction |
Additional info: These notes expand on the original slides and examples, providing definitions, formulas, and context for business statistics students. Images included are directly relevant to the explanation of each concept.
