 Back
Discrete Probability Distributions: Binomial, Poisson, and Hypergeometric
Study Guide - Smart Notes
 Tailored notes based on your materials, expanded with key definitions, examples, and context.
Discrete Probability Distributions
Overview of Probability Distributions
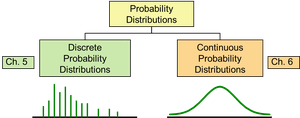
Probability distributions are fundamental tools in statistics for describing how probabilities are assigned to possible outcomes of random variables. They are classified into two main types: discrete and continuous probability distributions.
Discrete Probability Distributions: Concerned with random variables that take on a finite or countable number of values.
Continuous Probability Distributions: Concerned with random variables that can take on any value within a given range.
Discrete vs. Continuous Random Variables
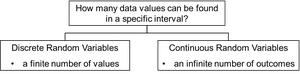
Random variables are classified based on the nature of their possible outcomes:
Discrete Random Variables: Have a finite number of values, typically whole numbers (e.g., number of complaints per day).
Continuous Random Variables: Have an infinite number of possible outcomes, often measured (e.g., time, height).
Rules for Discrete Probability Distributions
Definition and Properties
A discrete probability distribution lists all possible outcomes for a discrete random variable and their associated probabilities. The following rules must be satisfied:
Each outcome must be mutually exclusive.
The probability of each outcome must be between 0 and 1 (inclusive).
The sum of the probabilities for all outcomes must equal 1.
Example: Tossing Two Coins
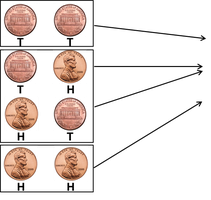
Consider an experiment where two coins are tossed. The random variable x represents the number of heads observed. The possible outcomes are:
0 heads
1 head
2 heads
Mean, Variance, and Standard Deviation of Discrete Probability Distributions
Mean (Expected Value)
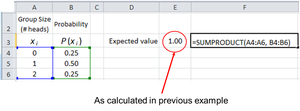
The mean (μ) of a discrete probability distribution is the weighted average of the outcomes, also known as the expected value. The formula is:
μ: Mean of the distribution
xi: Value of the random variable for the i-th outcome
P(xi): Probability of the i-th outcome
n: Number of outcomes
Variance and Standard Deviation
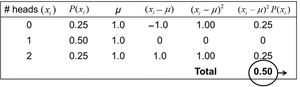
The variance (σ2) measures the spread of values around the mean. The formula is:
The standard deviation (σ) is the square root of the variance:
Comparing Distributions
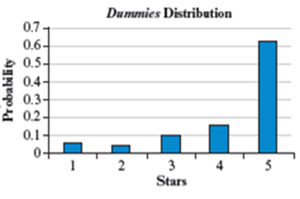
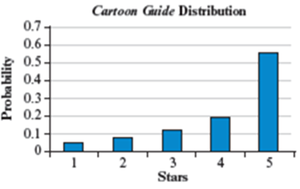
The mean and standard deviation are useful for comparing different distributions, such as reviewer ratings for two books. The probability distributions for each book can be visualized and compared.
Specific Discrete Probability Distributions
Overview
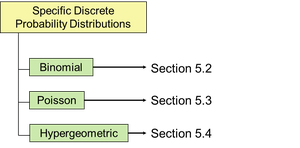
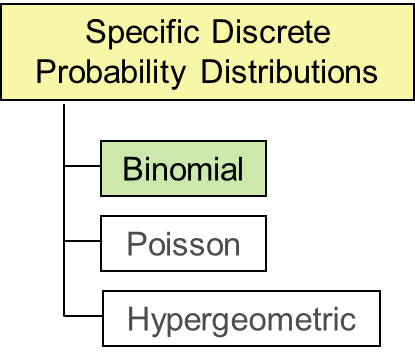
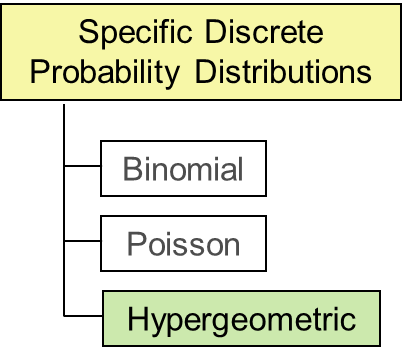
Three important discrete probability distributions are commonly used in business statistics: binomial, Poisson, and hypergeometric distributions.
Binomial Distribution
Characteristics of a Binomial Experiment
A binomial experiment consists of a fixed number of independent trials, each with two possible outcomes: success or failure. The probability of success (p) and failure (q) remain constant throughout the experiment.
Fixed number of trials (n)
Each trial is independent
Two possible outcomes per trial
Constant probabilities p and q
Binomial Probability Formula
The probability of observing exactly x successes in n trials is given by:
n: Number of trials
x: Number of successes
p: Probability of success
q: Probability of failure (q = 1 - p)
Example: Binomial Distribution for Proposition A
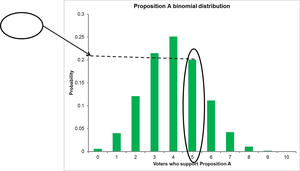
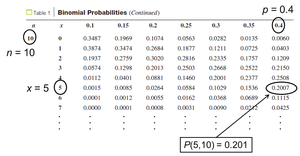
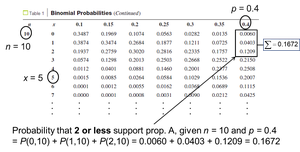
Suppose 40% of voters support Proposition A. In a sample of 10 voters, the probability that exactly 5 support the proposition can be calculated using the binomial formula or probability tables.
Mean and Standard Deviation of Binomial Distribution
The mean and standard deviation for a binomial distribution are calculated as:
μ: Expected number of successes
σ: Variation in the number of successes
Using Excel for Binomial Probabilities
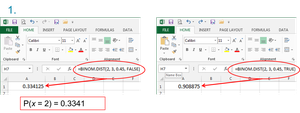
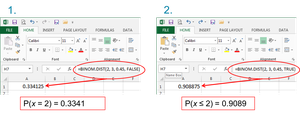
Excel's BINOM.DIST function can be used to calculate binomial probabilities:
BINOM.DIST(x, n, p, FALSE): Probability of exactly x successes
BINOM.DIST(x, n, p, TRUE): Probability of x or fewer successes
Poisson Distribution
Characteristics and Applications
The Poisson distribution is used to model the probability of a given number of events occurring in a fixed interval of time or space. It is appropriate when events occur independently and the mean rate is constant.
Counting occurrences over intervals
Constant mean rate (λ)
Independence between intervals
Poisson Probability Formula
The probability of observing exactly x occurrences is:
λ: Mean number of occurrences
x: Number of occurrences
e: Euler's number (≈ 2.71828)
Variance of Poisson Distribution
The variance of a Poisson distribution is equal to its mean:
Example: Probability of Customer Arrivals
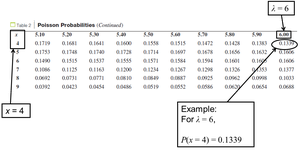
Suppose a bank averages 12 customers per hour. To find the probability that exactly 4 customers arrive in 30 minutes (λ = 6), use the Poisson formula or probability tables.
Hypergeometric Distribution
Characteristics and Applications
The hypergeometric distribution is used when sampling is done without replacement from a finite population. The probability of success changes during the sampling process, violating the binomial requirements.
Finite population (N)
Number of successes in population (R)
Sample size (n)
Number of successes in sample (x)
Hypergeometric Probability Formula
The probability of x successes in a sample of size n is:
N: Population size
R: Number of successes in population
n: Sample size
x: Number of successes in sample
Mean and Standard Deviation of Hypergeometric Distribution
The mean and standard deviation are calculated as:
Using Excel for Hypergeometric Probabilities
Excel's HYPGEOM.DIST function calculates hypergeometric probabilities:
HYPGEOM.DIST(x, n, R, N, FALSE): Probability of exactly x successes
HYPGEOM.DIST(x, n, R, N, TRUE): Probability of x or fewer successes
