 Back
BackDiscrete Probability Distributions: Concepts, Calculations, and Applications
Study Guide - Smart Notes
 Tailored notes based on your materials, expanded with key definitions, examples, and context.
Discrete Probability Distributions
Introduction to Discrete Probability Distributions
Discrete probability distributions are fundamental in business statistics, describing the likelihood of various outcomes for random variables that take on distinct, countable values. Understanding these distributions enables decision-makers to quantify uncertainty and make informed choices.
Random Variable: A variable whose value is determined by chance.
Discrete Random Variable: Can only assume a finite or countably infinite set of values (e.g., 0, 1, 2, ...).
Continuous Random Variable: Can assume an uncountable infinite number of values (e.g., any value within an interval).
Examples of Discrete Random Variables:
Number of complaints per day
Number of TVs in a household
Number of rings before the phone is answered
Binary outcomes: gender (male/female), defective item (yes/no), game result (win/loss)
Example: Real estate listings in La Quinta, California show homes with various numbers of bedrooms. The variable of interest is x = number of bedrooms. The probability of each possible outcome is based on the relative frequency of occurrence.
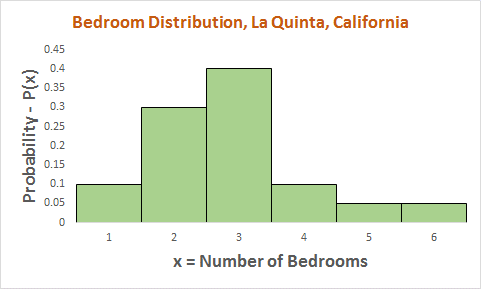
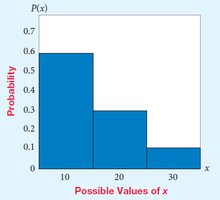
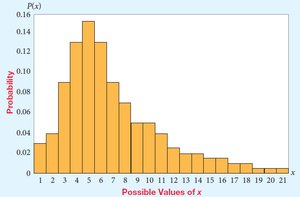
Graphical Presentation of Probability Distributions
Probability distributions can be visualized using bar charts or histograms, which display the probability associated with each possible value of the random variable.
Expected Value and Standard Deviation
Expected Value of a Discrete Probability Distribution
The expected value (mean) of a discrete probability distribution represents the average value when the experiment is repeated many times. It is calculated as:
x: Values of the discrete random variable
P(x): Probability of the random variable taking on the value x
Example: Calculating the expected number of bedrooms in homes for sale.
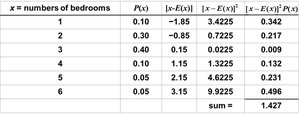
Standard Deviation of a Discrete Random Variable
The standard deviation measures the spread or dispersion in the values of a random variable. It is calculated as:
Indicates how much the values of the random variable deviate from the mean.
Example: Calculating the standard deviation for a dice game where the payout is $1 times the value on a 6-sided die.
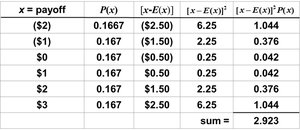
Expected Value and Standard Deviation: Coin Toss Example
Consider an experiment where two coins are tossed and x is the number of heads. There are four possible outcomes.

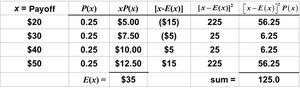
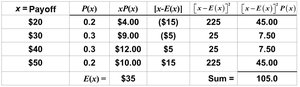
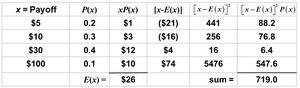
Expected Value and Standard Deviation: Investment Options
Calculating expected payoff and standard deviation helps compare investment options based on risk and return.
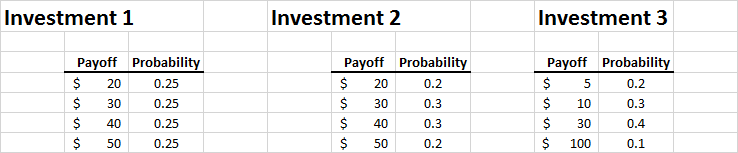
Investment 1:
Investment 2:
Investment 3:
The Binomial Probability Distribution
Definition and Properties
The binomial distribution gives the probability of x successes in n trials, where each trial has only two possible outcomes (success or failure), a fixed number of trials, independence between trials, and a constant probability of success p.
n: Number of trials
x: Number of successes
p: Probability of success
q: Probability of failure (q = 1 - p)
Examples:
Inspecting products (defective/acceptable)
Bidding for contracts (win/lose)
Survey responses (yes/no)
Job offers (accept/reject)
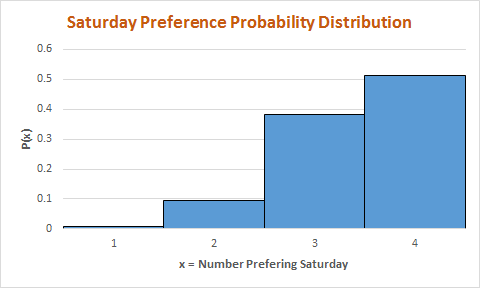
Binomial Distribution Example: Bank Customer Preferences
A bank surveys customers to determine preference for Saturday opening. The binomial distribution is used to model the number of customers preferring Saturday.
Binomial Formula
The probability of x successes in n trials is given by:
n!: Factorial of n
x!: Factorial of x
p: Probability of success
q: Probability of failure
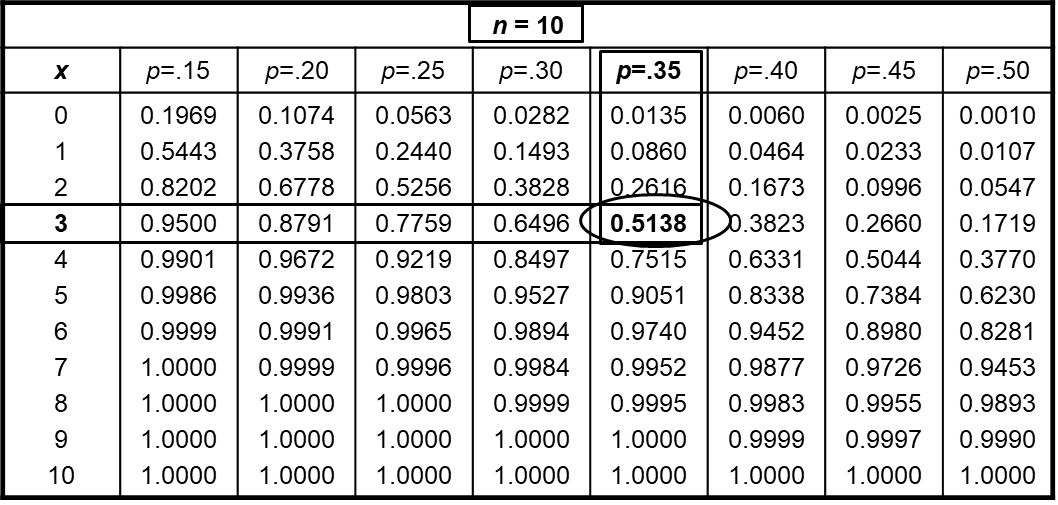
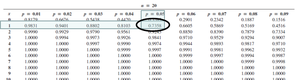
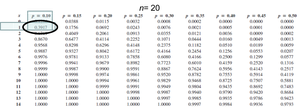
Using the Cumulative Binomial Table
Cumulative binomial tables are used to find the probability of obtaining up to a certain number of successes in a fixed number of trials. For example, if 35% of the population supports a regulation and 10 voters are polled, the probability that three or fewer support the proposition can be found using the table.
Finding Exact Probabilities
To find the probability of exactly x successes, subtract the cumulative probability for x-1 from the cumulative probability for x.
Mean and Standard Deviation for Binomial Distribution
The mean and standard deviation for a binomial distribution are calculated as:
Mean (μ): Expected number of successes
Standard Deviation (σ): Spread of the distribution
Applications: Quality Testing Using Binomial Distribution
Acceptance Sampling Plan
In quality testing, binomial distribution helps determine the probability of accepting shipments based on defect rates. For example, a plan may accept shipments with 1 or fewer defects and reject those with more.
Objective: High probability of accepting good shipments, low probability of accepting bad shipments.
Discussion: The effectiveness of the sampling plan depends on the probabilities calculated for accepting good versus bad shipments.
Additional info: Academic context and explanations have been expanded for clarity and completeness. All tables and images included are directly relevant to the explanation of the adjacent paragraphs.
