 Back
BackEstimating Single Population Parameters: Confidence Intervals and Sample Size
Study Guide - Smart Notes
 Tailored notes based on your materials, expanded with key definitions, examples, and context.
Estimating Single Population Parameters
Introduction
This chapter focuses on statistical methods for estimating single population parameters, specifically the population mean and population proportion. The key concepts include point estimates, confidence interval estimates, and determining the required sample size for accurate estimation. These tools are essential for business decision-making, allowing managers and analysts to make informed judgments based on sample data.
Point Estimates
A point estimate is a single statistic calculated from a sample that is used to estimate a corresponding population parameter. For example, the sample mean (\bar{x}) is used as a point estimate for the population mean (\mu). However, point estimates are subject to sampling error and are almost always different from the true population value.
Definition: A point estimate is a sample statistic used to estimate a population parameter.
Example: If a sample of 100 credit card accounts has a mean balance of $2,000, then $2,000 is the point estimate for the population mean balance.
Confidence Interval Estimates
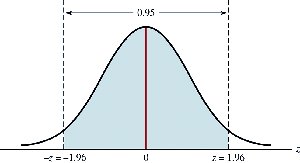
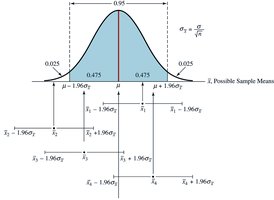
A confidence interval estimate provides a range of values, constructed from sample data, that is likely to contain the true population parameter. The confidence level (e.g., 95%) indicates the probability that the interval includes the parameter if repeated samples are taken.
General Format:
Confidence Level: The percentage of intervals that will contain the true parameter if repeated samples are taken.
Margin of Error: Half the width of the confidence interval; increases with higher confidence level and decreases with larger sample size.
Confidence Interval for Population Mean (\mu) When \sigma Is Known
When the population standard deviation (\sigma) is known and the population is normally distributed, the confidence interval for the mean is:
Formula: where:
= sample mean
= critical value from the standard normal distribution
= population standard deviation
= sample size
Example: For a sample mean of , and 95% confidence (): Interval: to
Margin of Error
Definition: The margin of error is the amount added and subtracted from the point estimate to form the confidence interval.
Formula:
Example: For the above example, margin of error is .
Impact of Confidence Level and Sample Size
Increasing the confidence level increases the margin of error.
Increasing the sample size decreases the margin of error.
There is a trade-off between confidence level, margin of error, and sample size.
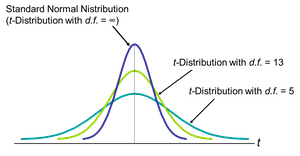
Confidence Interval for Population Mean (\mu) When \sigma Is Unknown: t-Distribution
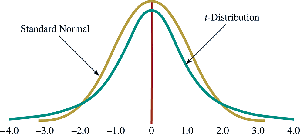
When the population standard deviation is unknown, the t-distribution is used. The t-distribution is more spread out than the standard normal distribution and depends on the degrees of freedom (df = n - 1).
Formula: where:
= sample mean
= critical value from t-distribution
= sample standard deviation
= sample size
Example: For n = 10, sample mean = 4.5, sample standard deviation = 1.3, 95% confidence (): Interval: to
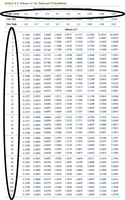
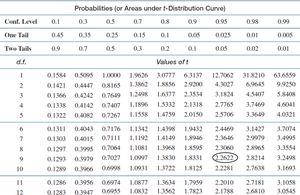
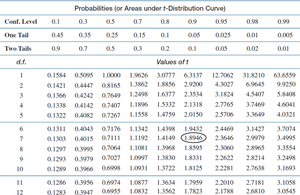
t-Distribution Table
The t-distribution table provides critical values for different confidence levels and degrees of freedom.
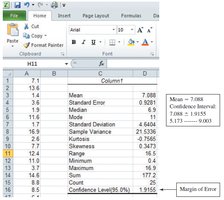
Using Excel for Confidence Intervals
Excel can be used to calculate confidence intervals by inputting sample data and using built-in statistical functions.

Determining Required Sample Size
To achieve a desired margin of error and confidence level, the required sample size can be calculated. The sample size depends on the confidence level, margin of error, and population variation.
Formula (\sigma known): where is the desired margin of error.
Always round up to ensure the margin of error is not exceeded.
Factors affecting sample size:
Higher confidence level requires larger sample size.
Lower margin of error requires larger sample size.
Greater population variation requires larger sample size.
Estimating a Population Proportion
When estimating the proportion of a population with a certain attribute, the sample proportion (\hat{p}) is used as the point estimate. The standard error and confidence interval for the proportion are calculated as follows:
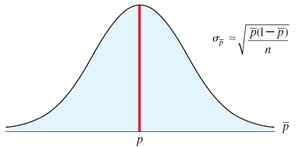
Sample Proportion: where is the number of items with the attribute, is the sample size.
Standard Error:
Confidence Interval:
Example: For n = 100, x = 22, 99% confidence (): Interval: to
Sample Size for Estimating a Population Proportion
Formula: where is the desired margin of error.
If no pilot sample is available, use for a conservative estimate.
Summary of Key Points
Point estimates are subject to sampling error.
Confidence intervals provide a range likely to contain the true parameter.
The margin of error is half the width of the confidence interval.
Increasing the confidence level increases the margin of error.
Increasing the sample size decreases the margin of error.
Sample size requirements depend on margin of error, confidence level, and population variation.
Additional info: Academic context was added to clarify formulas, examples, and the use of Excel for confidence interval estimation.
