 Back
Exploratory Data Analysis I: One Parameter – Foundations of Business Statistics
Study Guide - Smart Notes
 Tailored notes based on your materials, expanded with key definitions, examples, and context.
Statistics, Data, and Statistical Thinking
Introduction to Data and Statistics
Statistics is the science of collecting, analyzing, interpreting, and presenting data to support decision-making. In business, data can come from surveys, transactions, time series, or digital sources such as social media and autonomous systems.
Data: Observations gathered on characteristics of interest (e.g., survey responses, transaction records).
Examples: Economic indicators, payment transactions, social media data, sensor data from vehicles.
Why Do We Need Statistics?
Statistics enables us to make sense of data, derive patterns, and support or refute theories. It is essential for making informed business decisions.
The PPDAC Cycle
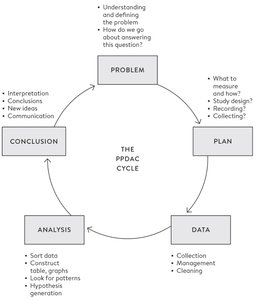
The PPDAC cycle is a structured approach to statistical inquiry, guiding the process from problem definition to conclusion.
Problem: Define and understand the question.
Plan: Decide what to measure, how, and design the study.
Data: Collect, manage, and clean the data.
Analysis: Sort, construct tables/graphs, and look for patterns.
Conclusion: Interpret results, draw conclusions, and communicate findings.
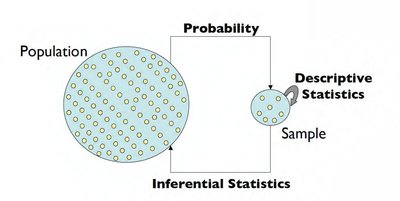
Descriptive and Inferential Statistics
Types of Statistical Analysis
There are two main branches of statistics:
Descriptive Statistics (Exploratory Data Analysis): Summarizes and describes the main features of a dataset using summary statistics and graphical representations.
Inferential Statistics: Makes predictions or inferences about a population based on sample data, using probability theory.
Key Statistical Terms
Population: The entire set of subjects of interest.
Parameter: A numerical summary of the population (e.g., population mean).
Sample: A subset of the population used for analysis.
Sample Statistic: A numerical summary of the sample data (e.g., sample mean).
Example: Airport Satisfaction Survey
Population: All passengers’ satisfaction ratings (e.g., 30 million per year).
Parameter: Mean satisfaction rating of all passengers.
Sample: 2,000 respondents’ ratings.
Sample Statistic: Mean rating of the 2,000 respondents.
Sources of Error in Inference
Inference involves uncertainty due to differences between the sample and the population. Probability theory and statistical methods (e.g., sampling distributions, confidence intervals, hypothesis testing) help quantify and manage this uncertainty.
Tabular and Graphical Presentation of Data
Data Types
Understanding data types is crucial for choosing appropriate summary and visualization methods.
Quantitative Data: Numerical values (can be continuous or discrete).
Qualitative Data: Non-numerical, categorical values (can be nominal or ordinal).
Continuous: Infinite possible values (e.g., height, commuting time).
Discrete: Finite number of values (e.g., number of siblings, letter grades).
Ordinal: Categories with a natural order (e.g., cell size level, letter grades).
Nominal: Categories without a natural order (e.g., favorite colors, college major).
Summarizing Qualitative-Nominal Data
Frequency distributions and bar plots are commonly used to summarize categorical data.
Soft Drink | Frequency | Proportion | Percentage |
|---|---|---|---|
Coca-Cola | 19 | 0.38 | 38 |
Diet Coke | 8 | 0.16 | 16 |
Dr. Pepper | 5 | 0.10 | 10 |
Pepsi | 13 | 0.26 | 26 |
Sprite | 5 | 0.10 | 10 |
Total | 50 | 1.00 | 100 |
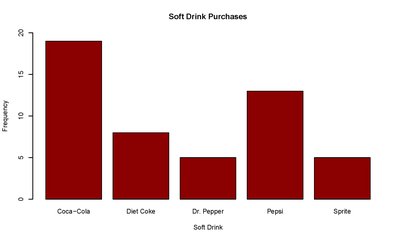
Good and Bad Graphs
A good graph is clear, matches the data type, and includes informative titles, labels, and scales. Avoid unnecessary complexity (e.g., 3D effects, excessive colors).
Numerical Measures of Data
Summarizing Quantitative Data
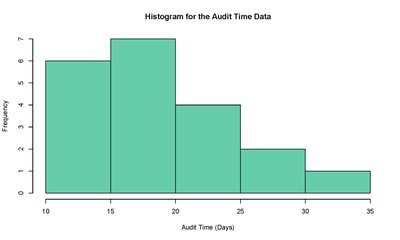
Quantitative data can be summarized using frequency distributions, histograms, and box plots.
Audit Time (days) | Frequency | Proportion | Percentage |
|---|---|---|---|
10–15 | 6 | 0.30 | 30 |
16–20 | 7 | 0.35 | 35 |
21–25 | 4 | 0.20 | 20 |
26–30 | 2 | 0.10 | 10 |
31–35 | 1 | 0.05 | 5 |
Total | 20 | 1.00 | 100 |
Box Plot
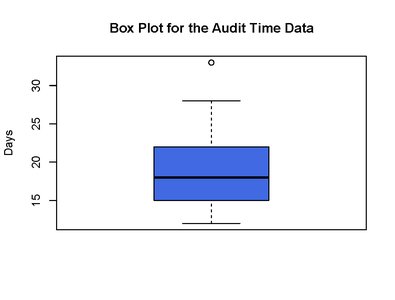
A box plot visually summarizes the distribution of data, showing the median, quartiles, and potential outliers.
Box: Spans from Q1 (25th percentile) to Q3 (75th percentile).
Line in box: Median value.
Whiskers: Minimum and maximum values (excluding outliers).
Outlier: Value outside the range Q1 - 1.5×IQR or Q3 + 1.5×IQR.
Numerical Measures of Location
Mean (Sample Mean):
Median: The middle value in an ordered dataset.
Mode: The value that occurs most frequently.
Percentiles: The value below which a given percentage of observations fall.
Quartiles: Q1 (25th percentile), Q2 (median, 50th percentile), Q3 (75th percentile).
Numerical Measures of Variability (Dispersion)
Range: Difference between maximum and minimum values.
Variance (Sample):
Standard Deviation (Sample):
Interquartile Range (IQR):
Mean vs. Median
For symmetric distributions, mean = median.
For skewed distributions, mean ≠ median (mean is pulled toward the longer tail).
Discussion: Statistical Thinking in Practice
Evaluating Statistical Claims
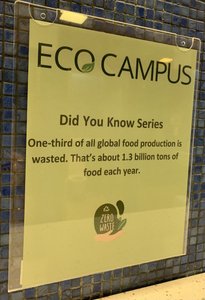
When encountering statistical statements (e.g., "One-third of all global food production is wasted. That’s about 1.3 billion tons of food each year."), consider:
What is the population being studied?
How is the key variable (e.g., "food waste") defined and measured?
What data and methods support the estimate?
What additional information would increase credibility?
Additional info: These foundational concepts prepare students for deeper topics such as probability, sampling, estimation, hypothesis testing, and regression analysis in business statistics.
