 Back
BackFoundations of Statistics: Populations, Samples, Data Types, and Measurement Levels
Study Guide - Smart Notes
 Tailored notes based on your materials, expanded with key definitions, examples, and context.
Q1. What exactly is statistics? (Define in your own words)
Background
Topic: Introduction to Statistics
This question is testing your understanding of what statistics is and why it is important in business and data analysis.
Key Terms:
Statistics: The science of collecting, organizing, analyzing, and interpreting data to make decisions or answer questions.
Step-by-Step Guidance
Think about the process of making decisions using information. What steps are involved?
Consider how data is gathered and used to answer questions or solve problems.
Try to summarize, in your own words, what statistics means based on these ideas.
Try solving on your own before revealing the answer!
Q2. What are some real-life examples of statistics in use?
Background
Topic: Applications of Statistics
This question asks you to connect statistics to everyday life and business scenarios.
Key Terms:
Application: The use of statistical methods to solve real-world problems or make decisions.
Step-by-Step Guidance
Think about areas where data is collected and analyzed (e.g., business, healthcare, sports, government).
Identify at least two specific examples where statistics help inform decisions or measure outcomes.
Explain briefly how statistics is used in each example.
Try solving on your own before revealing the answer!
Q3. Why do Computer Science and Business majors need statistics?
Background
Topic: Importance of Statistics in Different Fields
This question is about understanding the relevance of statistics to your major and future career.
Key Terms:
Data-driven decision making: Using data and statistical analysis to guide business or technical choices.
Step-by-Step Guidance
Consider the types of problems you might solve in your major (e.g., analyzing trends, making predictions).
Think about how statistics can help you interpret data and make informed decisions.
List at least one reason why statistical knowledge is valuable in your field.
Try solving on your own before revealing the answer!
Q4. Suppose you are trying to decide if you should adopt a cat or a dog. Would it be practical to ask every person in the United States about it? Why or why not?
Background
Topic: Populations and Samples
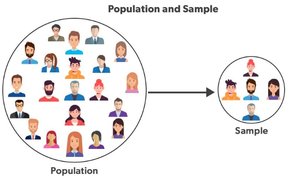
This question tests your understanding of the difference between a population and a sample, and the practicality of data collection.
Key Terms:
Population: The entire group you want to study or draw conclusions about.
Sample: A subset of the population, selected for analysis.
Step-by-Step Guidance
Think about the size of the population (all people in the United States).
Consider the resources (time, money, effort) required to survey everyone.
Reflect on why researchers often use samples instead of entire populations.
Try solving on your own before revealing the answer!
Q5. What is data? Define in your own words.
Background
Topic: Data in Statistics
This question is about understanding what data is and why it is fundamental to statistics.
Key Terms:
Data: Information collected from observations, measurements, or responses.
Step-by-Step Guidance
Think about what you measure or observe when collecting information.
Try to express, in your own words, what data means in the context of statistics.
Try solving on your own before revealing the answer!
Q6. What is the difference between a data set and a database? Explain.
Background
Topic: Data Organization
This question is about distinguishing between two ways of organizing data.
Key Terms:
Data set: A collection of related data, often in table form.
Database: An organized system for storing, managing, and retrieving multiple data sets.
Step-by-Step Guidance
Think about the scale and complexity of each (data set vs. database).
Consider how each is used in business or research settings.
Explain the main difference in your own words.
Try solving on your own before revealing the answer!
Q7. What is the difference between Quantitative and Qualitative Data? Explain.
Background
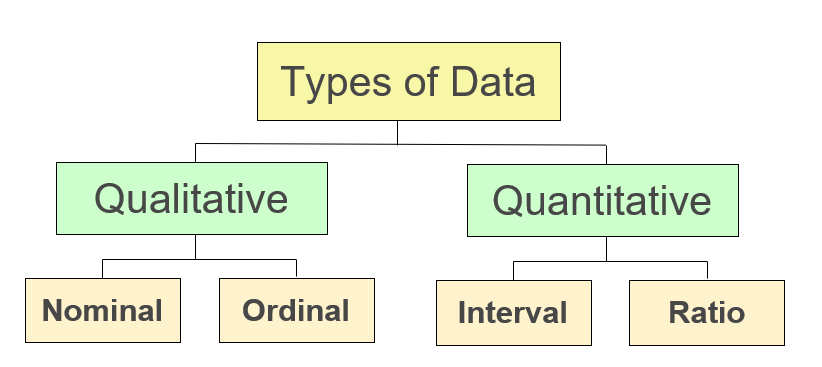
Topic: Types of Data
This question is about understanding the two main categories of data and their characteristics.
Key Terms:
Quantitative Data: Data that can be measured or counted (numerical).
Qualitative Data: Data that describes qualities or categories (non-numerical).
Step-by-Step Guidance
Think about examples of data that are numbers (e.g., height, age) versus categories (e.g., color, type).
Describe the main difference in how each type of data is used or analyzed.
Explain why distinguishing between these types is important in statistics.
Try solving on your own before revealing the answer!
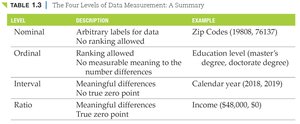
Q8. What are the four levels of data measurement? Give a brief description and example for each.
Background
Topic: Levels of Measurement
This question is about understanding how data can be classified based on the information it provides and the mathematical operations that are meaningful.
Key Terms and Table:
Nominal: Categories with no order (e.g., zip codes).
Ordinal: Categories with a meaningful order, but differences are not meaningful (e.g., education level).
Interval: Ordered, meaningful differences, but no true zero (e.g., calendar year).
Ratio: Ordered, meaningful differences, and a true zero (e.g., income).
Step-by-Step Guidance
List each level and provide a brief description in your own words.
Give one example for each level, based on the table or your own experience.
Think about why knowing the level of measurement is important for statistical analysis.
Try solving on your own before revealing the answer!
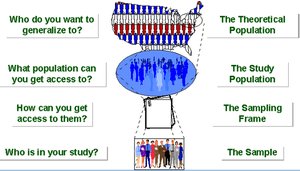
Q9. What is a population, sample, sampling frame, parameter, and statistic? Define each term.
Background
Topic: Statistical Terminology
This question is about understanding the foundational terms used in designing and interpreting statistical studies.
Key Terms:
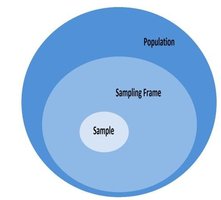
Population: The entire group being studied.
Sample: A subset of the population.
Sampling Frame: The list or source from which the sample is drawn.
Parameter: A numerical summary of a population.
Statistic: A numerical summary of a sample.
Step-by-Step Guidance
Define each term in your own words, using the diagrams as a visual aid.
Think about how these terms relate to each other in a research study.
Explain why distinguishing between these terms is important for interpreting results.
Try solving on your own before revealing the answer!
