 Back
BackHypothesis Testing for a Single Population: Concepts, Procedures, and Applications
Study Guide - Smart Notes
 Tailored notes based on your materials, expanded with key definitions, examples, and context.
Hypothesis Testing for a Single Population
Introduction to Hypothesis Testing
Hypothesis testing is a fundamental statistical method used to make inferences about population parameters based on sample data. It involves formulating two competing hypotheses and using sample evidence to decide which hypothesis is more consistent with the observed data.
Null Hypothesis (H0): Represents the status quo or a statement of no effect or no difference. It is assumed true unless evidence suggests otherwise.
Alternative Hypothesis (H1): Represents the claim or effect that the researcher wants to test. It is considered true if the null hypothesis is rejected.
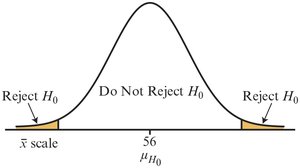
Example: Testing whether the average time spent on a web page is different from 56 seconds.


Types of Hypothesis Tests
Two-Tail Test: Used when the alternative hypothesis is expressed as ≠ (not equal to). The rejection regions are in both tails of the sampling distribution.
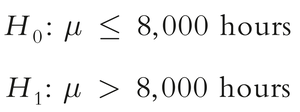
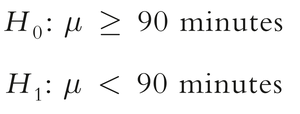
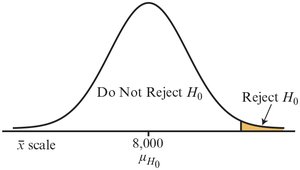
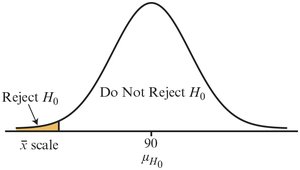
One-Tail Test: Used when the alternative hypothesis is expressed as < or >. The rejection region is in only one tail of the distribution.
Examples:
Logic and Errors in Hypothesis Testing
Hypothesis testing relies on proof by contradiction. We never accept the null hypothesis; we either reject it or fail to reject it based on sample evidence.
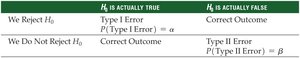
Type I Error (α): Rejecting H0 when it is actually true (false positive).
Type II Error (β): Failing to reject H0 when it is actually false (false negative).
The probabilities of these errors are inversely related for a fixed sample size. Increasing the sample size can reduce both errors simultaneously.
Hypothesis Testing for the Population Mean When σ Is Known
Procedure and Example
When the population standard deviation (σ) is known, the z-test is used. The sampling distribution of the sample mean is normal if the sample size is large (n ≥ 30) or the population is normal for small samples.
State the hypotheses.
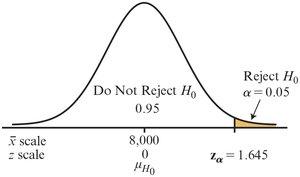
Set the significance level (α).
Determine the critical value (zα).
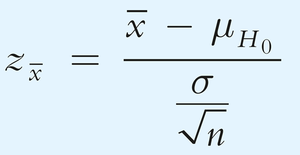
Calculate the test statistic.
Compare the test statistic to the critical value and make a decision.
State the conclusion.
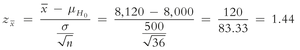
Test Statistic Formula:
Example Calculation:
Compare the calculated z to the critical value:
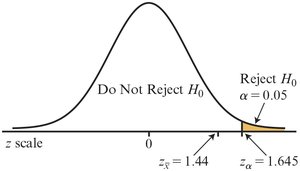
Decision rules for hypothesis tests:

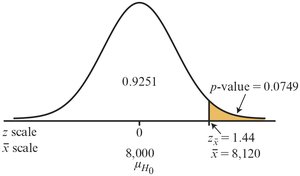
The p-value Approach
The p-value is the probability of observing a test statistic as extreme as, or more extreme than, the observed value under the null hypothesis. If the p-value is less than α, reject H0.

Hypothesis Testing for the Population Mean When σ Is Unknown
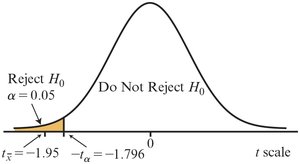
Using the t-Distribution
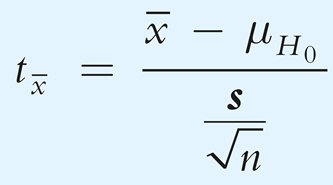
When σ is unknown, the sample standard deviation (s) is used, and the t-distribution is applied. The t-distribution is wider than the normal distribution, especially for small sample sizes.
Test Statistic Formula:

Example Calculation:
Critical values are found using t-tables or statistical software (e.g., Excel's T.INV or T.DIST functions).
Hypothesis Testing for the Proportion of a Population
Testing Proportions
Proportion data follow the binomial distribution, which can be approximated by the normal distribution if both np ≥ 5 and n(1 – p) ≥ 5.
Sample Proportion Formula:
z-Test Statistic for Proportion:
Example: One-Tail Test for Proportion
Suppose we want to test if the proportion of LinkedIn users aged 30–39 is greater than 34%. In a sample of 240 users, 96 are in this age group. Set α = 0.05.
Step 1: State hypotheses (H0: p ≤ 0.34, H1: p > 0.34).
Step 2: Set α = 0.05.
Step 3: Find critical value (zα = 1.645).
Step 4: Calculate test statistic and compare to critical value.
Step 5: State conclusion based on comparison or p-value.
Type II Errors and Power of a Test
Understanding β and Power
The probability of a Type II error (β) is the chance of failing to reject a false null hypothesis. The power of a test is 1 – β, representing the probability of correctly rejecting a false null hypothesis.
Lowering α increases β for a fixed sample size.
Increasing sample size reduces both α and β.
Example: Calculating β for a hypothesis test about the mean driving range of electric cars.
Summary Table: Critical z-Scores for Common α Levels
Alpha (α) | One Tail: Critical z-Score | Two Tail: Critical z-Score |
|---|---|---|
0.01 | 2.33 | 2.575 |
0.02 | 2.05 | 2.33 |
0.05 | 1.645 | 1.96 |
0.10 | 1.28 | 1.645 |
Conclusion
Hypothesis testing is a structured process for making statistical decisions about population parameters. Understanding the types of errors, the use of z and t distributions, and the interpretation of p-values is essential for correct application and interpretation of results in business statistics.
