 Back
BackHypothesis Tests Comparing Two Populations: Business Statistics Study Guide
Study Guide - Smart Notes
 Tailored notes based on your materials, expanded with key definitions, examples, and context.
Hypothesis Tests Comparing Two Populations
Overview
This chapter focuses on statistical methods for comparing two populations, specifically through hypothesis testing. The goal is to determine whether differences exist between population means or proportions, using independent or dependent samples. These techniques are fundamental in business statistics for making data-driven decisions.
Types of Comparisons
Population Means (Independent Samples): Comparing means from two separate groups.
Population Means (Dependent Samples): Comparing means from paired or matched samples (e.g., before and after measurements).
Population Proportions (Independent Samples): Comparing proportions from two distinct groups.
Comparing Two Population Means with Independent Samples
Known Population Standard Deviations (σ1 and σ2)
When the population standard deviations are known, hypothesis testing uses the Z-test. The samples must be independent and normally distributed, or large enough for the central limit theorem to apply (n1 > 30 and n2 > 30).
Null Hypothesis (H0): μ1 = μ2
Alternative Hypothesis (HA): μ1 ≠ μ2 (or >, < depending on context)
Test Statistic Formula:
Critical Value: Use Z-table based on significance level (α).
Example: Comparing Checkout Times
Suppose a supermarket manager wants to compare the mean checkout times for standard and Fast Lane methods. Given known population standard deviations and sample sizes, the Z-test is used to determine if the Fast Lane is faster.
Step 1: State hypotheses (e.g., H0: μStandard ≤ μFast Lane, HA: μStandard > μFast Lane).
Step 2: Choose significance level (e.g., α = 0.01).
Step 3: Calculate test statistic using the formula above.
Step 4: Find critical value from Z-table (e.g., 2.33 for α = 0.01, one-tailed).
Step 5: Compare test statistic to critical value and make a decision.
Conclusion: If the test statistic exceeds the critical value, reject the null hypothesis and conclude the Fast Lane is faster.
Comparing Two Population Means with Independent Samples (Unknown σ1 and σ2, Assumed Equal)
Using the t-Test
When population standard deviations are unknown but assumed equal, the t-test is used. The pooled variance combines information from both samples.
Pooled Variance Formula:
Test Statistic Formula:
Degrees of Freedom: df = n1 + n2 - 2
Critical Value: Use t-table based on α and df.
Hypothesis Testing with Dependent Samples (Matched-Pair Test)
Overview
Dependent samples occur when each observation in one sample is paired with an observation in the other (e.g., before and after treatment). The matched-pair test analyzes the differences between pairs.
Null Hypothesis (H0): μd = 0 (no difference)
Alternative Hypothesis (HA): μd ≠ 0 (difference exists)
Test Statistic Formula:
Where: \bar{d} is the mean difference, sd is the standard deviation of differences, n is the number of pairs.
Degrees of Freedom: df = n - 1
Critical Value: Use t-table for α and df.
Example: Customer Service Training
A company measures the number of customer complaints before and after training for each salesperson. The differences are analyzed using the matched-pair t-test.
Step 1: Compute differences for each pair.
Step 2: Calculate mean and standard deviation of differences.
Step 3: Calculate test statistic.
Step 4: Find critical value from t-table.
Step 5: Compare test statistic to critical value and make a decision.
Conclusion: If the test statistic does not fall in the rejection region, do not reject the null hypothesis; there is insufficient evidence of a significant change.
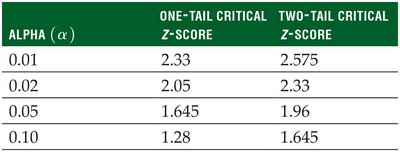
Summary Table: Critical z-Scores for Various Alpha Levels
This table provides critical z-scores for common significance levels, used in hypothesis testing for known population standard deviations.
Alpha (α) | One-Tail Critical Z-Score | Two-Tail Critical Z-Score |
|---|---|---|
0.01 | 2.33 | 2.575 |
0.02 | 2.05 | 2.33 |
0.05 | 1.645 | 1.96 |
0.10 | 1.28 | 1.645 |
Key Terms and Concepts
Independent Samples: Samples drawn from separate populations with no relationship between them.
Dependent Samples: Samples where each observation in one sample is paired with an observation in the other.
Pooled Variance: Combined estimate of variance when population variances are unknown but assumed equal.
Critical Value: Threshold value used to determine whether to reject the null hypothesis.
Significance Level (α): Probability of rejecting the null hypothesis when it is true; common values are 0.01, 0.05, and 0.10.
Summary
Hypothesis tests comparing two populations are essential tools in business statistics for evaluating differences between groups. The choice of test depends on whether samples are independent or dependent, and whether population standard deviations are known. Proper application of these tests enables informed decision-making based on statistical evidence.
