 Back
BackHypothesis Tests Comparing Two Populations: Means and Proportions
Study Guide - Smart Notes
 Tailored notes based on your materials, expanded with key definitions, examples, and context.
Hypothesis Tests Comparing Two Populations
Comparing Two Population Means with Independent Samples (Known Population Standard Deviations)
When comparing the means of two independent populations, hypothesis testing helps determine if there is a statistically significant difference between the two means. This is commonly used in business statistics to compare groups such as federal vs. private sector salaries.
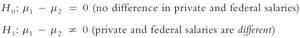
Null Hypothesis (H0): Assumes no difference between the population means.
Alternative Hypothesis (H1): Assumes a difference exists between the population means.
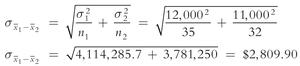
Standard Error of the Difference Between Two Means
The standard error measures the variability of the difference between two sample means:
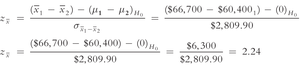
Test Statistic (z-test)
The z-test statistic for comparing two means (when population standard deviations are known) is:
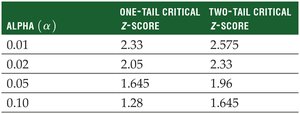
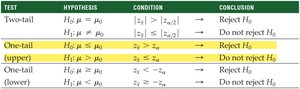
Critical Values and Decision Rules
Critical z-scores are used to determine the rejection region for the hypothesis test. For a two-tailed test at α = 0.05, the critical value is ±1.96.
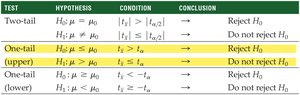
Decision rules for hypothesis tests are summarized as follows:
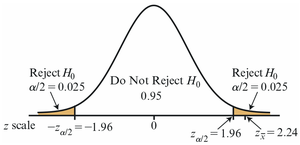
Graphical Representation of the Test
The rejection regions for the null hypothesis are shown in the tails of the normal distribution curve:
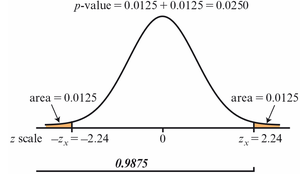
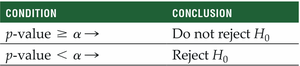
p-value Calculation and Interpretation
The p-value is the probability of observing a test statistic as extreme as, or more extreme than, the observed value under the null hypothesis. For a two-tailed test:
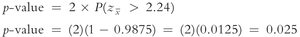
Decision rule based on p-value:
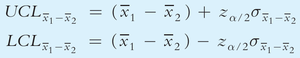
Confidence Interval for the Difference Between Two Means
A confidence interval estimates the range in which the true difference between two population means lies with a certain level of confidence (e.g., 95%).
Formulas:
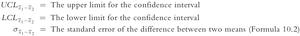
Example calculation:
Comparing Two Population Means with Independent Samples (Unknown Population Standard Deviations)
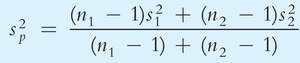
When population standard deviations are unknown, the t-distribution is used. If variances are assumed equal, a pooled variance is calculated.
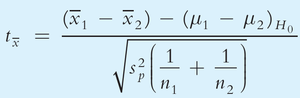
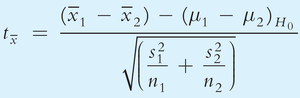
t-test Statistic and Pooled Variance
The t-test statistic is:
Pooled variance formula:
Decision rules for t-tests:
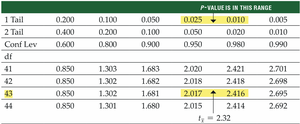
Critical t-scores are found using degrees of freedom (df = n1 + n2 – 2):
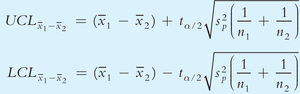
Confidence Interval for the Difference Between Two Means (Unknown, Equal Variances)
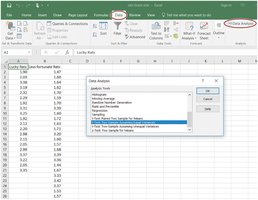
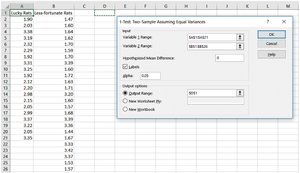
Using Excel for Hypothesis Testing (Equal Variances)
Excel can be used to perform a two-sample t-test assuming equal variances:
Enter data and select Data Analysis → t-Test: Two-Sample Assuming Equal Variances.
Fill in the dialog box with the appropriate ranges and parameters.
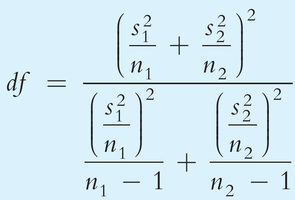
t-test Statistic for Unequal Variances
If population variances are not assumed equal, use the following t-test statistic and degrees of freedom formula:
Degrees of freedom:
Hypothesis Testing with Dependent Samples (Matched Pairs)
Dependent samples occur when each observation in one sample is paired with an observation in the other sample. The matched-pair t-test is used to analyze the differences within pairs.
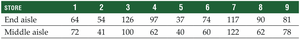
Example Data Table
Calculating Matched-Pair Differences
The difference for each pair is:
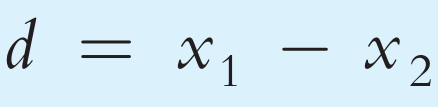
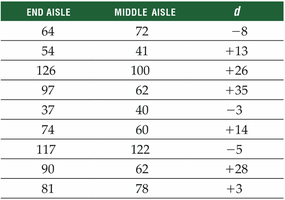
Table of Differences
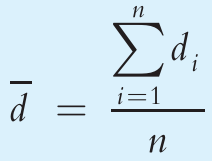
Mean of the Matched-Pair Differences
Summary Table: Key Formulas and Decision Rules
Test | Statistic | Decision Rule |
|---|---|---|
Two Means, σ known | Compare to critical z-score | |
Two Means, σ unknown, equal | (pooled variance) | Compare to critical t-score |
Two Means, σ unknown, unequal | (separate variances) | Compare to critical t-score (df by formula) |
Matched Pairs | for differences | Compare to critical t-score (n-1 df) |
Note: Always check assumptions (normality, independence, equal variances) before applying these tests.
