 Back
BackCh . 19 Linear Patterns and Simple Regression: Study Notes for Business Statistics
Study Guide - Smart Notes
 Tailored notes based on your materials, expanded with key definitions, examples, and context.
Linear Patterns and Simple Regression
Fitting a Line to Data
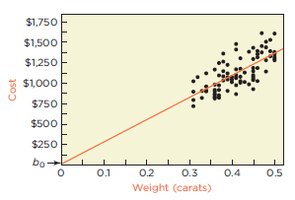
Regression analysis is a statistical method used to examine the relationship between two quantitative variables. In business statistics, it is commonly applied to estimate how one variable (such as price) changes in response to another (such as weight). The fitted line summarizes this linear association and helps in prediction and interpretation.
Regression Equation: The equation of a fitted line is typically written as , where b0 is the intercept and b1 is the slope.
Intercept (b0): Represents the estimated value of the response variable when the predictor variable is zero.
Slope (b1): Indicates the estimated change in the response variable for a one-unit increase in the predictor variable.
Least Squares Method: The best-fitting line minimizes the sum of squared residuals (vertical deviations from the line).
Example: In the diamond pricing example, regression analysis relates price (y) to weight (x).
Interpreting the Fitted Line
Once a regression line is fitted, its coefficients can be interpreted in the context of the data. For diamonds, the estimated regression equation is:
Intercept (b0): (fixed cost per diamond)
Slope (b1): (marginal cost per carat)
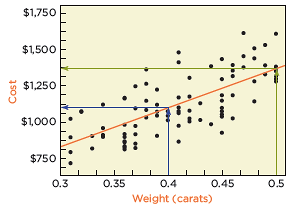
Example Calculations:
Average price for 0.4-carat diamond:
Average price for 0.5-carat diamond:
Difference:
Interpretation Notes:
The intercept estimates the average response when x = 0, but if the data range does not include zero, it is an extrapolation.
The slope estimates the marginal cost, but it is not correct to say it causes the change in y.
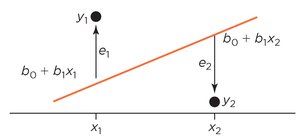
Properties of Residuals
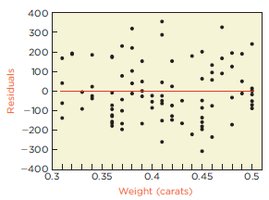
Residuals are the differences between observed values and those predicted by the regression line. Analyzing residuals helps assess the fit and validity of the model.
Residuals (e): , where is the predicted value.
Residual Plot: Should show no pattern if the linear model is appropriate.
Standard Deviation of Residuals (se): Measures the spread of residuals around the fitted line. Also called root mean squared error.
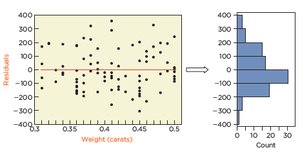
Example: For the diamond data, $s_e = $145. By the empirical rule, about 95% of prices are within $290 of the regression line.
Explaining Variation
Regression analysis quantifies how much of the variation in the response variable is explained by the predictor variable.
R-squared (r2): The square of the correlation coefficient. Represents the fraction of variation explained by the regression line.
For the diamond example, (50% of price variation explained).
Always report both and to summarize the fit.
Conditions for Simple Regression
To ensure valid regression results, certain conditions must be met:
No Lurking Variables: No other explanatory variables should better explain the association.
Linearity: The scatterplot should show a linear pattern.
Random Residual Variation: Residual plot should show no pattern.
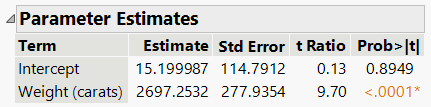
Summary Table: Regression Coefficients
Term | Estimate | Std Error | t Ratio | Prob>|t| |
|---|---|---|---|---|
Intercept | 15.199987 | 114.7912 | 0.13 | 0.8949 |
Weight (carats) | 2697.2532 | 277.9354 | 9.70 | <.0001* |
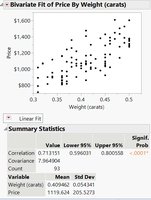
Summary Table: Bivariate Fit Statistics
Statistic | Value | Lower 95% | Upper 95% | Signif. Prob |
|---|---|---|---|---|
Correlation | 0.713115 | 0.596031 | 0.800588 | <.0001* |
Count | 93 | |||
Weight (carats) Mean | 0.409682 | |||
Weight (carats) Std Dev | 0.054341 | |||
Price Mean | 1119.684 | |||
Price Std Dev | 205.5273 |
Additional info: The notes and images are directly relevant to Chapter 21 (The Simple Regression Model) and Chapter 22 (Regression Diagnostics) of a business statistics course.
