 Back
BackMultiple Linear Regression: Special Topics in Business Statistics
Study Guide - Smart Notes
 Tailored notes based on your materials, expanded with key definitions, examples, and context.
Multiple Linear Regression: Special Topics
Indicator (Dummy) Variables in Regression
Indicator or dummy variables are used to include categorical predictors in regression models. These variables allow the regression equation to account for differences between categories by coding them numerically.
Definition: An indicator variable is assigned a value of 1 if an observation belongs to a specific category, and 0 otherwise.
Number of Variables: For a categorical variable with c categories, use c - 1 indicator variables.
Base Category: The category not represented by an indicator variable is the base category, defined by all indicators being 0.
Interpretation: The coefficient of a dummy variable represents the difference in the mean response between that category and the base category, effectively shifting the intercept.
Example: If "Vendor.1" and "Vendor.2" are dummy variables for three suppliers, the regression equation is: Where "Vendor.1 = 1" if Supplier 1, "Vendor.2 = 1" if Supplier 2, and both 0 if Supplier 3 (base category).
Interaction Terms in Regression
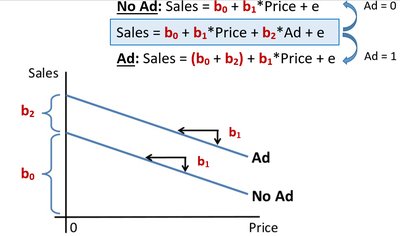
Interaction terms allow the effect (slope) of a quantitative predictor to differ across categories of a categorical variable. This is achieved by multiplying the indicator variable by the quantitative predictor.
Definition: An interaction term is the product of a dummy variable and a quantitative predictor.
Interpretation: The coefficient of the interaction term shows how much the slope of the quantitative predictor changes for the category compared to the base category.
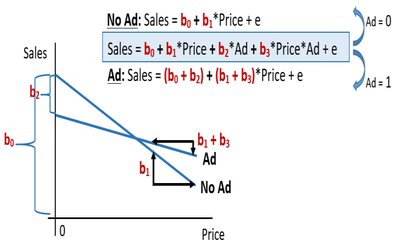
Model Example: For a model with an interaction between "Ad" (0/1) and "Price":
No Ad:
Ad:
Here, is the coefficient for the interaction term "Price*Ad".
Collinearity and Multicollinearity
Collinearity occurs when two or more predictor variables are highly correlated, which can undermine the reliability of the regression coefficients.
Symptoms: Large standard errors for coefficients, unstable estimates, and conflicting results between overall F-tests and individual t-tests.
Implication: Makes it difficult to determine the individual effect of correlated predictors.
Non-Linear Relationships and Transformations
When the relationship between the response and predictor is non-linear, regression models can be adapted using polynomial terms or variable transformations.
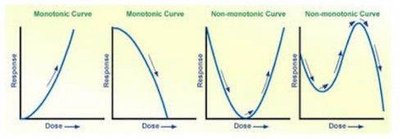
Polynomial Regression: Add higher-order terms (e.g., , ) to model non-monotonic curves (curves that change direction).
Transformations: Apply mathematical transformations (e.g., log, square root, reciprocal) to variables to linearize monotonic relationships.
Tukey's Ladder of Powers: Guides the choice of transformation to achieve linearity.
Monotonic vs. Non-Monotonic:
Monotonic increasing: Transform X up the ladder or Y down the ladder.
Monotonic decreasing: Transform X up the ladder or Y up the ladder.
Non-monotonic (e.g., parabola): Use polynomial regression; transformations are generally not successful.
Summary Table: Approaches for Non-Linear Patterns
Curve Type | Recommended Approach |
|---|---|
Monotonic Increasing | Transform X up the ladder or Y down the ladder; polynomial also possible |
Monotonic Decreasing | Transform X up the ladder or Y up the ladder; polynomial also possible |
Non-monotonic (Parabola) | Polynomial regression (2nd order); transformations not successful |
Non-monotonic (multiple changes) | Polynomial regression (3rd order or higher); transformations not successful |
