 Back
BackMultiple Regression Analysis and Model Building
Study Guide - Smart Notes
 Tailored notes based on your materials, expanded with key definitions, examples, and context.
Multiple Regression Analysis and Model Building
Introduction to Multiple Regression Analysis
Multiple regression analysis is an extension of simple linear regression that allows for the inclusion of two or more independent variables to predict a single dependent variable. This technique is widely used in business statistics to model and forecast outcomes based on several influencing factors.
Definition: Multiple regression estimates the relationship between a dependent variable and multiple independent variables.
Example Application: A local retail store may predict weekly sales (dependent variable) using factors such as local unemployment rate, weekly average high temperature, number of community activities, and average gasoline price.
Population and Estimated Multiple Regression Model
The population multiple regression model expresses the dependent variable as a linear function of several independent variables plus an error term. The estimated model uses sample data to approximate the population parameters.
General Form:
Where:
= Dependent variable
= Intercept (regression constant)
= Regression coefficients for each independent variable
= Independent variables
= Model error (random disturbance)
Developing a Multiple Regression Model: Real Estate Example
To illustrate multiple regression, consider a real estate firm aiming to predict residential property sales prices. The dependent variable is the sales price, and the independent variables are selected based on their potential influence on price.
Selected Independent Variables:
Home size in square feet ()
Age of house ()
Number of bedrooms ()
Number of bathrooms ()
Garage size (number of cars, )
Data Collection: A sample of 328 properties was considered, but only 319 had complete data for all variables.
Computing the Regression Equation
The regression equation is estimated using the sample data. Each coefficient in the equation represents the average change in the dependent variable for a one-unit change in the corresponding independent variable, holding all other variables constant.
Interpretation Example:
If the coefficient for square footage is 63.07, then increasing the house size by 1 square foot increases the sales price by $63.07, holding other variables constant.
If the coefficient for age is -1,144.44, then each additional year of age decreases the sales price by $1,144.44, holding other variables constant.
Point Estimate Example: For a house with 2,100 square feet, 15 years old, 4 bedrooms, 3 bathrooms, and a 2-car garage, the estimated sales price is $179,739.41.
The Multiple Coefficient of Determination (R2)
The multiple coefficient of determination, denoted as R2, measures the proportion of the total variation in the dependent variable that is explained by the regression model. It is a key indicator of model fit.
Formula:
Interpretation: An R2 of 0.8161 means that over 81% of the variation in sales price is explained by the model's independent variables.
Testing Model Significance: The F-Test
To determine if the regression model is statistically significant, an F-test is conducted. The null hypothesis states that all regression coefficients are zero, while the alternative hypothesis states that at least one coefficient is not zero.
Hypotheses:
H0:
H1: At least one
Decision Rule: Compare the p-value from the F-test to the chosen significance level (alpha). If p-value < alpha, reject H0 and conclude the model is significant.
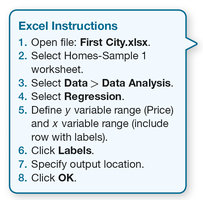
Using Software for Multiple Regression
Statistical software such as Excel can be used to perform multiple regression analysis efficiently. The process involves specifying the dependent and independent variables, running the regression, and interpreting the output.
Steps in Excel:
Open the relevant data file.
Select the worksheet with the data.
Go to Data > Data Analysis and select Regression.
Define the y variable range (dependent variable) and x variable range (independent variables).
Click Labels if your data includes headers.
Specify the output location and click OK.
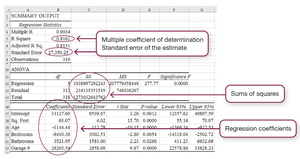
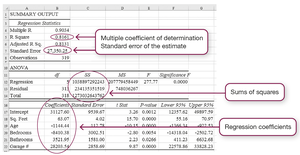
Summary Table: Key Elements in Regression Output
The regression output typically includes several important statistics, such as the multiple R, R2, adjusted R2, standard error, ANOVA table, and regression coefficients. These elements help in evaluating the model's fit and the significance of each predictor.
Statistic | Description |
|---|---|
Multiple R | Correlation coefficient between observed and predicted values |
R Square (R2) | Proportion of variance explained by the model |
Adjusted R Square | R2 adjusted for the number of predictors |
Standard Error | Standard deviation of the regression residuals |
ANOVA Table | Breakdown of variance into regression and residual components |
Regression Coefficients | Estimates of the effect of each independent variable |
