 Back
BackNumerical Descriptive Measures for Business Statistics: Location, Variability, and Relative Standing
Study Guide - Smart Notes
 Tailored notes based on your materials, expanded with key definitions, examples, and context.
Numerical Descriptive Measures of Data Sets
Introduction
Numerical descriptive measures are essential tools in business statistics for summarizing and interpreting data sets. These measures help describe the central tendency, variability, and relative standing of data, providing managers and analysts with actionable insights for decision-making.
Measures of Location
Mode
The mode is the value that occurs most frequently in a data set. It is useful for identifying the most common outcome but may not be effective for small or highly variable data sets.
Definition: The value with the highest frequency in the data set.
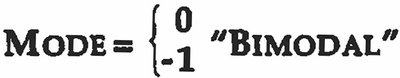
Example: In the data set {10, 5, -1, -1, 0, 2, -1, 0, 3, 2, 4, 5}, the mode is -1.
Bimodal: If two values occur with the same highest frequency, the distribution is bimodal.
Median
The median is the middle value of an ordered data set. It is less sensitive to extreme values than the mean and provides a robust measure of central tendency.
Definition: The value that divides the ordered data set into two equal halves.
Calculation: For n observations, the median is at position in the ordered list.
Example: In the ordered set {5, 8, 8, 9, 12}, the median is 8.
Mean
The mean (arithmetic average) is the sum of all observations divided by the number of observations. It is widely used but sensitive to outliers.
Definition:
Example: For the data set {4, 5, 14, 9, 7}, the mean is .
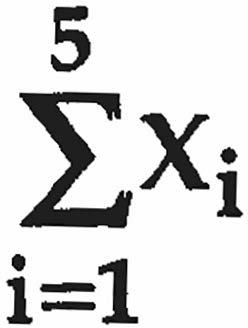
Summation Notation:
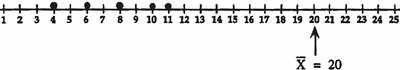
Physical Interpretation: The mean represents the balance point of the data set.
Sensitivity: The mean is affected by extreme observations (outliers).
Mean vs. Median
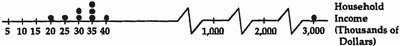
Comparing the mean and median can reveal the skewness of a distribution. The median is more robust to outliers, while the mean can be pulled by extreme values.
Example: In income data, the mean may be much higher than the median due to a few very high incomes.
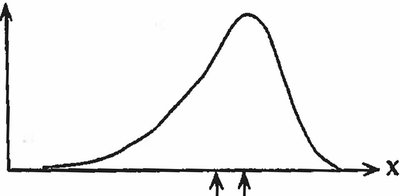
Inferring Distribution Shape
The relationship between the mean and median helps infer the shape of the frequency distribution:
If mean > median: Right-skewed distribution
If mean < median: Left-skewed distribution
If mean ≈ median: Symmetric distribution
Measures of Variability
Range
The range is the difference between the largest and smallest values in a data set. It provides a simple measure of spread but is sensitive to outliers.
Definition:
Example: For the data set {10, 2, 3, 8}, the range is .
Problems: The range does not reflect the distribution of other data points and is sensitive to extreme values.
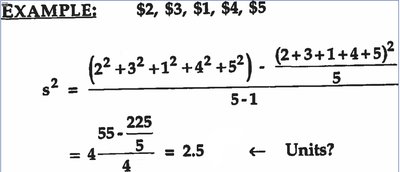
Variance and Standard Deviation
Variance and standard deviation measure the average squared deviation from the mean, providing a more comprehensive measure of variability.
Sample Variance:
Population Variance:
Standard Deviation:
Example: For the data set {s^2 = 2.5$
Measures of Relative Standing
Percentiles
Percentiles indicate the relative position of a value within a data set. The p-th percentile is the value below which p% of the data fall.
Definition: The value at which a given percentage of observations fall below.
Example: The 50th percentile is the median.
Z-Scores
A z-score measures how many standard deviations an observation is from the mean. It is useful for comparing values across different distributions.
Definition:
Example: For a taste score of 12, mean 7.94, and standard deviation 3.26:
Application: Summarizing Snack Food Taste Test Data
Data Collection and Questions
A food products firm collected taste scores from 100 consumers, rating a new snack food on a scale from 0 (hate) to 15 (love). Key questions include:
What is the central tendency of the scores?
How variable are the responses?
Are there outliers or unusual patterns?
Transforming Data into Information
To summarize and communicate the data:
Calculate mean, median, and mode.
Compute range, variance, and standard deviation.
Construct frequency distributions and histograms.
Use box plots to identify outliers and visualize spread.
Summary Table: Snack Food Taste Test Statistics
Statistic | Value |
|---|---|
Sample Size (n) | 100 |
Mean | 7.94 |
Median | 8 |
Variance | 10.62 |
Standard Deviation | 3.26 |

Communicating Results to Managers
Effective Summarization
Summarize the data using clear tables, graphs, and concise statistics. Highlight key findings such as average score, variability, and any notable outliers. Use visual aids like histograms and box plots to make the information accessible.
Mean and median provide a quick overview of consumer response.
Standard deviation and range indicate consistency or diversity in opinions.
Frequency distributions and histograms show the overall pattern of responses.
Additional info:
These notes cover core topics from Chapter 2: Methods for Describing Sets of Data, including measures of location, variability, and relative standing.
Visualizations and summary tables are essential for business decision-making and effective communication of statistical findings.
