 Back
BackNumerical Measures of Variability and Relative Standing in Business Statistics
Study Guide - Smart Notes
 Tailored notes based on your materials, expanded with key definitions, examples, and context.
Numerical Measures of Variability
Range
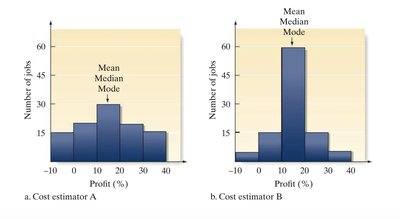
The range is a simple measure of variability in a quantitative data set, calculated as the difference between the largest and smallest measurements. It provides a quick sense of the spread of the data, but is considered insensitive for large data sets because it only considers the two extreme values.
Definition: Range = Largest value − Smallest value
Interpretation: A larger range indicates greater variability.
Limitation: Does not account for the distribution of values between the extremes.
Example: Profit margin per construction job for 100 jobs, comparing two cost estimators.
Variance and Standard Deviation
Variance and standard deviation are more comprehensive measures of variability, considering all data points. Variance measures the average squared deviation from the mean, while standard deviation is the square root of variance, providing a measure in the same units as the data.
Sample Variance Formula:
Alternative Formula:
Sample Standard Deviation:
Interpretation: Larger values of variance or standard deviation indicate greater variability.
Population Estimates: Sample variance () estimates population variance (); sample standard deviation () estimates population standard deviation ().
Example: Calculate range, variance, and standard deviation for the sample: 2, 3, 3, 3, 4.
Excel Function: =stdev(data) computes sample standard deviation.
Empirical Rule
Understanding Data Distribution
The Empirical Rule describes the distribution of data in a mound-shaped (normal) and symmetric histogram. It provides approximate percentages of data within certain intervals around the mean, based on standard deviation.
Approximately 68% of measurements fall within 1 standard deviation of the mean: for samples, for populations.
Approximately 95% fall within 2 standard deviations: or .
Approximately 99.7% fall within 3 standard deviations: or .
Applications of the Empirical Rule
The rule is useful for estimating the proportion of data within certain ranges and for making statistical inferences, even when the distribution is slightly skewed.
Application 1: Estimate the percentage of measurements within 1, 2, or 3 standard deviations of the mean.
Example: For a sample with mean and :
with 68% of observations.
with 94% of observations.
with 100% of observations.
Application 2: Make statistical inferences about the likelihood of events.
Example: If battery life is normally distributed with mean 60 months and standard deviation 10 months, estimate the percentage lasting less than 40 months.
Numerical Measures of Relative Standing
Percentiles
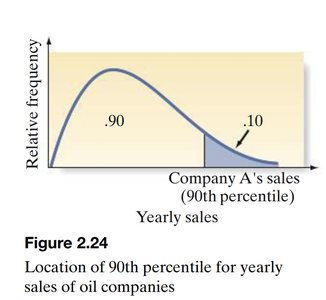
Percentiles indicate the relative standing of a measurement within a data set. The pth percentile is the value below which p% of the data fall. Common percentiles include the 25th (lower quartile), 50th (median), and 75th (upper quartile).
Definition: The pth percentile is the value such that p% of measurements are below it and (100-p)% are above.
Application: Used for large data sets, such as standardized test scores or company sales.
Example: The 90th percentile for yearly sales of oil companies marks the value above which only 10% of companies fall.
z-Score
The z-score measures how many standard deviations a data point is from the mean. It is a standardized way to compare values from different distributions.
Sample z-score formula:
Population z-score formula:
Interpretation: A z-score indicates how far and in what direction a value deviates from the mean.
Example: For a GMAT score of 440, with sample mean 540 and standard deviation 100:
Surprisingly low or high values: Observations with z-scores below -2 or above 2 are considered unusually low or high.
Empirical Rule and z-Scores
The Empirical Rule can also be expressed in terms of z-scores:
Approximately 68% of measurements have z-scores between -1 and 1.
Approximately 95% have z-scores between -2 and 2.
Approximately 99.7% have z-scores between -3 and 3.
Summary Table: Measures of Variability and Relative Standing
Measure | Definition | Formula | Interpretation |
|---|---|---|---|
Range | Difference between largest and smallest value | Range = Largest − Smallest | Quick measure of spread |
Variance | Average squared deviation from mean | Comprehensive measure of variability | |
Standard Deviation | Square root of variance | Variability in original units | |
Percentile | Value below which p% of data fall | Computed by software | Relative standing in data set |
z-Score | Standardized distance from mean | Comparison across distributions |
