 Back
BackOne-Way Analysis of Variance (ANOVA): Concepts, Application, and Interpretation
Study Guide - Smart Notes
 Tailored notes based on your materials, expanded with key definitions, examples, and context.
One-Way Analysis of Variance (ANOVA)
Introduction to ANOVA
One-way ANOVA is a statistical method used to compare the means of three or more independent groups to determine if at least one group mean is significantly different from the others. It extends the two-sample t-test to situations involving more than two populations, focusing on the impact of a single categorical variable (the factor) on a quantitative outcome.
Purpose: To test whether the means of multiple populations differ.
Factor: The independent variable with multiple levels (e.g., depth in a river).
Outcome: The dependent variable measured (e.g., aldrin concentration).
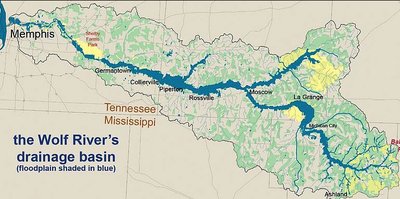
Example: Wolf River Study
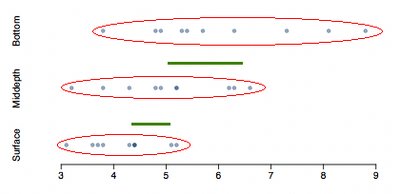
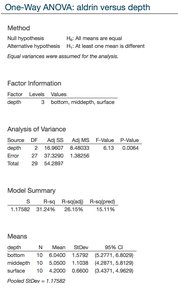
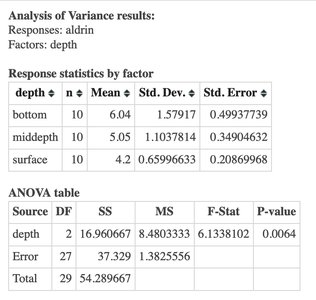
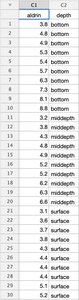
Researchers measured aldrin concentration at three depths (bottom, middepth, surface) in the Wolf River to assess whether depth affects concentration levels. This example illustrates the application of ANOVA in environmental studies.
Populations: Three levels of depth.
Factor: Depth.
Outcome: Aldrin concentration (nanograms per liter).
Why Not Use Multiple t-Tests?
Performing pairwise t-tests for each group combination increases the risk of Type I error (false positives) due to multiple comparisons. ANOVA controls this error rate by testing all means simultaneously.
Number of tests: For k groups, k(k-1)/2 pairwise tests are needed.
Type I Error: Increases with the number of tests.
Solution: Use ANOVA for overall comparison.
Hypotheses in ANOVA
ANOVA tests the following hypotheses:
Null Hypothesis (H0): All group means are equal ().
Alternative Hypothesis (HA): At least one group mean is different.
Assumptions of ANOVA
ANOVA relies on several key assumptions:
Independence: Observations are independent within and between groups.
Normality: Data within each group are approximately normally distributed.
Equal Variance: Variances across groups are roughly equal.
Checking Assumptions
Assumptions can be checked using graphical methods and summary statistics:
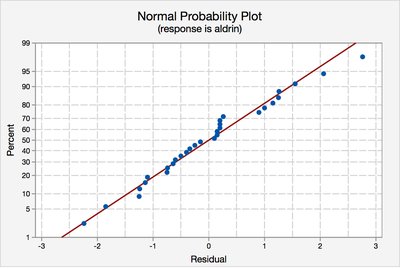
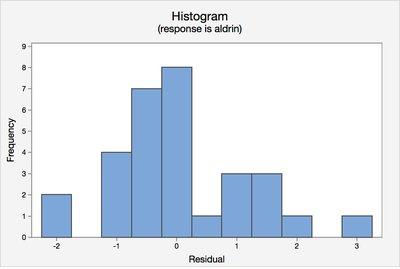
Normality: Use normal probability plots and histograms of residuals.
Equal Variance: Compare standard deviations across groups and examine residual plots.
Types of Variability in ANOVA
ANOVA partitions total variability in the data into two components:
Between-group variability: Differences between group means and the grand mean.
Within-group variability: Variability within each group.
Sum of Squares
Total Sum of Squares (SSTotal):
Group Sum of Squares (SST):
Error Sum of Squares (SSE):
ANOVA Table Structure
The results of ANOVA are summarized in a table:
Source | SS | DF | MS | F | P-value |
|---|---|---|---|---|---|
Model (Between Groups) | SST | I-1 | MST | MST/MSE | Calculated |
Error (Within Groups) | SSE | N-I | MSE | ||
Total | SSTotal | N-1 |
Test Statistic and P-value
The ANOVA test statistic is the F-ratio:
Mean Square Between (MST):
Mean Square Error (MSE):
F-statistic:
The p-value is the probability of observing an F-statistic as extreme as the calculated value under the null hypothesis, using the F-distribution with appropriate degrees of freedom.
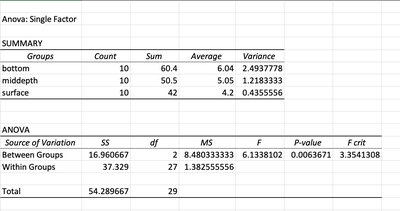
Interpreting Results
If the p-value is less than the significance level (e.g., 0.05), reject the null hypothesis and conclude that at least one group mean is different. If the p-value is greater, fail to reject the null hypothesis.
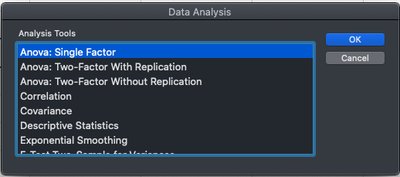
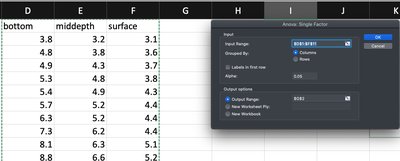
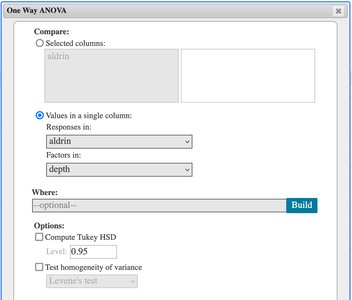
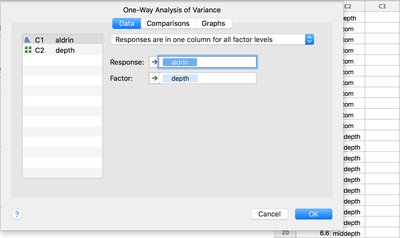
ANOVA in Statistical Software
ANOVA can be performed in various software packages, including StatCrunch, Minitab, and Excel. The process typically involves entering data, specifying the factor and response, and interpreting the output table.
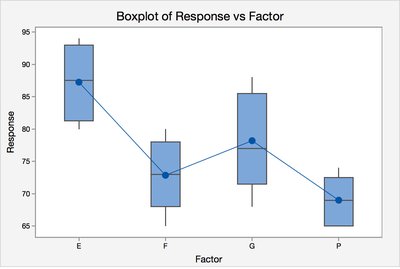
Application Example: Professor Ratings
In a business context, ANOVA can be used to compare mean grades across different student ratings of a professor. The process involves calculating SSTotal, SSE, and SST, then constructing the ANOVA table and interpreting the F-statistic and p-value.
Group | Sample Size | Mean Grade |
|---|---|---|
Excellent | 4 | 87.25 |
Good | 5 | 78.20 |
Fair | 7 | 72.86 |
Poor | 6 | 69.00 |
Summary
One-way ANOVA is a robust method for comparing means across multiple groups.
It controls Type I error and provides a global test for differences.
Assumptions must be checked for valid inference.
Interpretation focuses on whether at least one mean differs, not which specific means are different.
