 Back
BackOne-Way ANOVA and Post-Hoc Tests: Concepts, Calculations, and Applications
Study Guide - Smart Notes
 Tailored notes based on your materials, expanded with key definitions, examples, and context.
Analysis of Variance (ANOVA)
Introduction to One-Way ANOVA
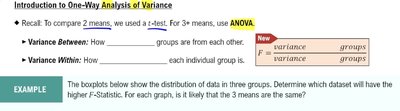
One-way Analysis of Variance (ANOVA) is a statistical method used to compare the means of three or more independent groups to determine if at least one group mean is significantly different from the others. It extends the t-test, which is limited to comparing two means, by analyzing the variance between and within groups.
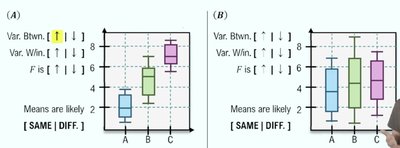
Variance Between Groups: Measures how much the group means differ from each other.
Variance Within Groups: Measures how much the data points within each group differ from their respective group mean.
F-statistic: The ratio of variance between groups to variance within groups. A higher F-statistic suggests greater evidence against the null hypothesis.
One-Way ANOVA Test Procedure
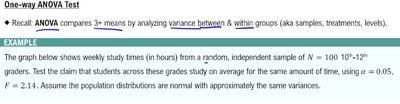
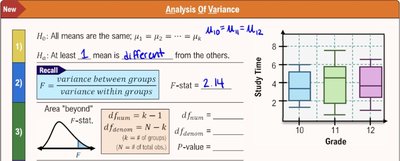
ANOVA compares 3 or more means by analyzing variance between and within groups (also called samples, treatments, or levels). The test involves the following hypotheses:
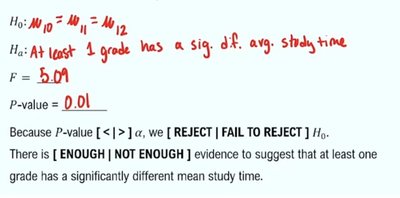
Null Hypothesis (H0): All group means are equal ().
Alternative Hypothesis (Ha): At least one group mean is different from the others.
The F-statistic is calculated as:
Decision Criteria and Assumptions
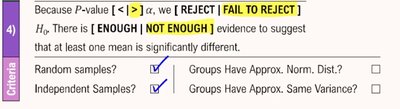
To interpret the ANOVA results, compare the P-value to the significance level ():
If P-value < , reject H0.
If P-value > , fail to reject H0.
There is enough evidence to suggest at least one mean is significantly different if H0 is rejected.
Assumptions:
Random samples
Independent samples
Groups have approximately normal distributions
Groups have approximately equal variances
Worked Example: ANOVA Calculation
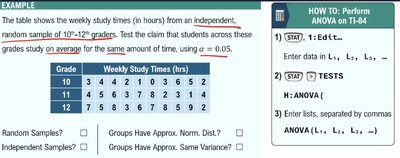
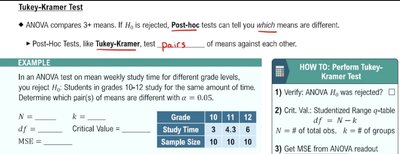
Suppose we have weekly study times (in hours) for students in grades 10, 11, and 12. We want to test if the mean study times are the same across grades at .
Grade | Weekly Study Times (hrs) |
|---|---|
10 | 3, 4, 5, 4, 2, 3, 4, 5, 6, 2 |
11 | 4, 5, 6, 7, 5, 6, 7, 8, 5, 6 |
12 | 5, 6, 7, 8, 7, 8, 9, 6, 7, 5 |
Given: , -value = 0.01
Since -value < , we reject H0.
There is enough evidence to suggest at least one grade has a significantly different mean study time.
Post-Hoc Tests: Identifying Which Means Differ
Tukey and Tukey-Kramer Tests
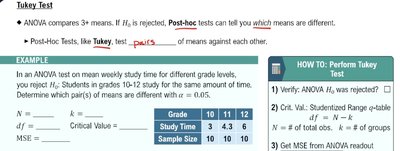
If ANOVA indicates significant differences, post-hoc tests such as the Tukey or Tukey-Kramer test are used to determine which specific group means are different. These tests compare all possible pairs of means.
Tukey Test: Used when group sizes are equal.
Tukey-Kramer Test: Used when group sizes are unequal.
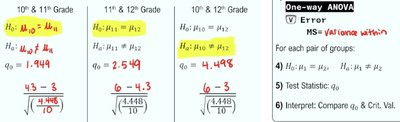
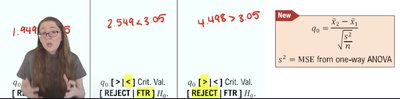
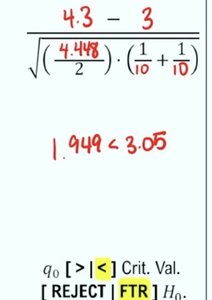
The test statistic for comparing means and is:
where is the mean square error (MSE) from the ANOVA table.
Interpreting Tukey Test Results
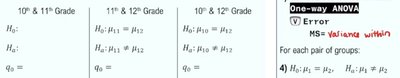
For each pair of groups:
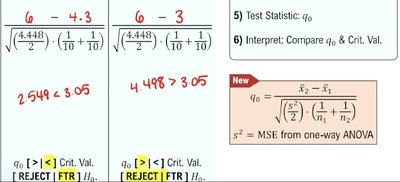
Calculate for the pair.
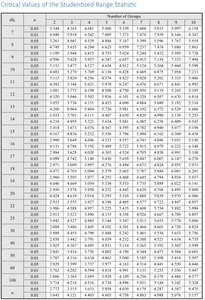
Compare to the critical value from the Studentized Range Table (based on degrees of freedom and number of groups).
If > critical value, reject H0 (means are significantly different).
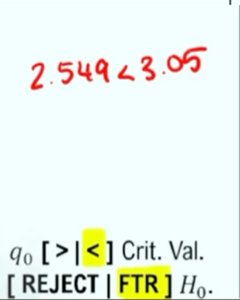
If < critical value, fail to reject H0 (means are not significantly different).
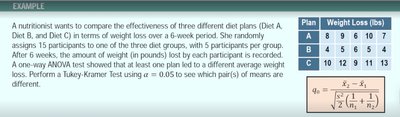
Worked Example: Tukey Test
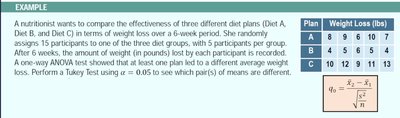
Suppose a nutritionist compares three diet plans (A, B, C) for weight loss. After ANOVA shows a significant difference, a Tukey test is performed to see which pairs differ.
Plan | Weight Loss (lbs) |
|---|---|
A | 8, 9, 6, 10, 7 |
B | 4, 5, 6, 5, 4 |
C | 10, 12, 11, 9, 13 |
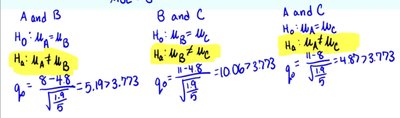
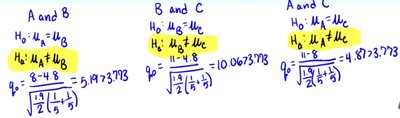
For each pair (A & B, B & C, A & C), calculate and compare to the critical value to determine which means are significantly different.
Tukey-Kramer Test
The Tukey-Kramer test is used when group sizes are unequal. The formula for is:
Interpretation is the same as the Tukey test: compare to the critical value to determine significance.
Summary Table: ANOVA and Post-Hoc Test Steps
Step | Description |
|---|---|
1 | State hypotheses (H0, Ha) |
2 | Check assumptions (random, independent, normality, equal variance) |
3 | Calculate F-statistic and P-value |
4 | Compare P-value to ; make decision |
5 | If H0 is rejected, perform post-hoc tests (Tukey/Tukey-Kramer) |
6 | Calculate for each pair, compare to critical value |
7 | Interpret results: identify which means differ |
Additional info: The Studentized Range Statistic table is used to find the critical value for Tukey and Tukey-Kramer tests, based on the number of groups and degrees of freedom for error.
