 Back
BackProbability Distributions of Continuous Random Variables and the Normal Distribution
Study Guide - Smart Notes
 Tailored notes based on your materials, expanded with key definitions, examples, and context.
Probability Distributions of Continuous Random Variables
Introduction to Continuous Random Variables
Continuous random variables are fundamental in business statistics, representing quantities that can take any value within a given interval. Unlike discrete random variables, which have countable outcomes, continuous random variables are associated with infinite possible values.
Definition: A random variable X assigns a numerical value to each outcome of an experiment.
Continuous random variable: Can take any value within an interval (not just discrete values).
Examples: Time to complete a task, mass of luggage, daily distance traveled by a vehicle.

Probability Distributions and Probability Density Functions
Continuous probability distributions are represented by curves, where the area under the curve between two values represents the probability that the variable falls within that interval.
Probability Density Function (PDF): Describes the distribution of probability for a continuous random variable.
Properties of PDF:
Total area under the curve is 1.
is the area under the curve between a and b.
for all x.
Probability is only meaningful for intervals, not specific values.

Population Parameters
Continuous random variables are characterized by population parameters:
Mean (): The expected value .
Variance (): Measures spread of the distribution.
Standard deviation (): Square root of variance.
The Normal Distribution
Definition and Properties
The normal distribution is the most widely used continuous probability distribution in practice, due to its prevalence in natural and business phenomena.
Mathematically derived: Based on probability theory.
Symmetry: The curve is symmetric about the mean ().
Standard deviation (): Influences the height and concentration of the curve.
Notation: denotes a normal distribution with mean and variance .

The Standard Normal Distribution
The standard normal distribution is a special case of the normal distribution with mean 0 and standard deviation 1. It is denoted as .
Bell-shaped curve: Centered at 0, with spread determined by standard deviation 1.
Notation: is used for the standard normal variable.
Calculating Probabilities Using the Standard Normal Table
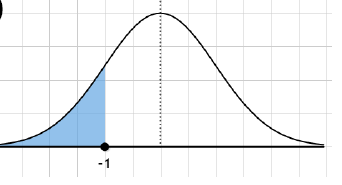
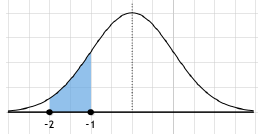
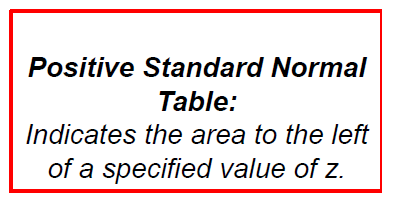
Probabilities for the standard normal distribution are calculated using the standard normal table, which gives the area to the left of a specified z-value.
Key properties:
and
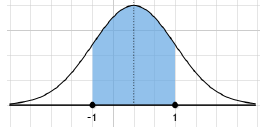
Interval probabilities:

Transforming x-values to z-values
To find probabilities for any normal random variable, x-values are transformed to z-values using the following formula:
Transformation formula:
Once transformed, use the standard normal table to find probabilities.
Finding Percentiles Using the Standard Normal Table
Percentiles are found by reversing the procedure: given a probability, find the corresponding x-value.
Steps:
Sketch the normal curve.
Use the z-table to identify the z-value for the given area.
Convert the z-value to the corresponding x-value using .
Application: For example, finding the minimum purchase value for the top 15% of customers.
Sampling Distributions and the Central Limit Theorem (CLT)
Introduction to Sampling Distributions
Sampling distributions describe the probability distribution of a statistic (such as the mean) calculated from a sample of a population.
Definition: The distribution of sample means (or other statistics) from repeated samples.
Importance: Underpins inferential statistics, allowing estimation and hypothesis testing.
The Central Limit Theorem (CLT)
The Central Limit Theorem states that, for a sufficiently large sample size, the sampling distribution of the sample mean will be approximately normal, regardless of the population's distribution.
Key points:
Sample means are normally distributed for large n.
Mean of sampling distribution equals population mean ().
Standard deviation of sampling distribution is .
The t-Distribution
The t-distribution is used when the population standard deviation is unknown and the sample size is small. It is similar to the normal distribution but has heavier tails.
Application: Used in confidence intervals and hypothesis testing for means.
Formula:
Additional info: The notes include self-evaluation exercises and practical examples to reinforce understanding of probability distributions and sampling theory.
