 Back
BackResiduals, Regression, and Prediction Intervals in Business Statistics
Study Guide - Smart Notes
 Tailored notes based on your materials, expanded with key definitions, examples, and context.
Correlation and Linear Regression
Introduction to Residuals
In regression analysis, residuals are the differences between observed values and the values predicted by a regression model. Examining residuals is essential for assessing the fit and appropriateness of a regression model. The initial scatter plot of the data may not always reveal all the interesting or problematic aspects of the data, making residual analysis a crucial step.
Scatter Plots and Regression Examples
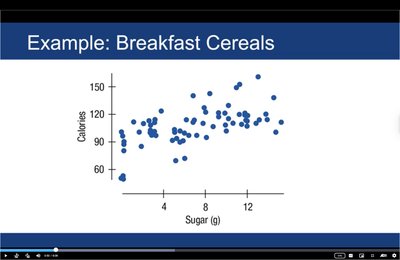
Scatter plots are used to visualize the relationship between two quantitative variables. For example, plotting the sugar content (g) versus calories in breakfast cereals can help identify trends and potential linear relationships.
Residual Plots
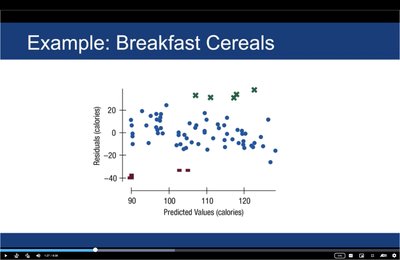
A residual plot displays the residuals on the vertical axis and the predicted values (or another variable) on the horizontal axis. This plot helps to identify non-random patterns, which may indicate problems with the model, such as non-linearity or the presence of subgroups.
Random scatter of residuals suggests a good fit.
Patterns (e.g., curves or clusters) suggest the model may not be appropriate.
Subgroups in Data
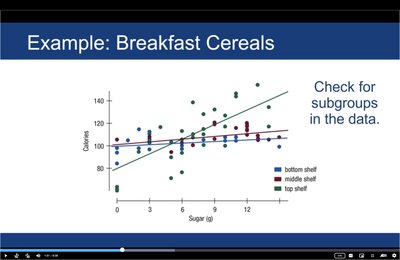
It is important to check for subgroups within the data, as different groups may have different relationships between variables. For example, in the breakfast cereals data, cereals from different shelf levels (bottom, middle, top) may show distinct trends.
Subgroups can be visualized by using different colors or symbols in scatter plots.
Separate regression lines can be fitted for each subgroup to better understand their relationships.
Extrapolation in Regression
Definition and Risks
Extrapolation refers to using a regression model to predict values of the dependent variable (y) for independent variable (x) values outside the range of the observed data. While regression models make it easy to predict y for any x, extrapolation can be risky, especially with economic and business data measured over time, as the relationship may not hold outside the observed range.
Residual Analysis and Residual Plots
Understanding Residuals
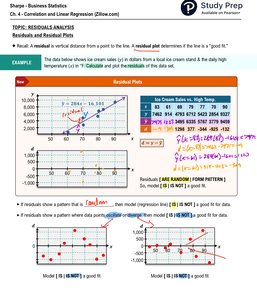
A residual is the vertical distance from a data point to the regression line. The residual plot helps determine if the regression model is a good fit for the data.
If residuals are randomly scattered, the model is appropriate.
If residuals show a pattern, the model may not be suitable.
Prediction Intervals in Regression
Steps to Make a Prediction Interval (TI-84 Example)
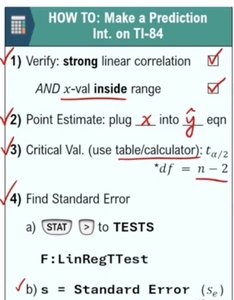
To construct a prediction interval for a regression estimate, follow these steps:
Verify a strong linear correlation and ensure the x-value is within the observed range.
Calculate the point estimate by plugging the x-value into the regression equation.
Find the critical value using a table or calculator, with degrees of freedom .
Find the standard error using regression output.
Calculate sample statistics: , , .
Compute the margin of error .
Determine the upper and lower bounds: .
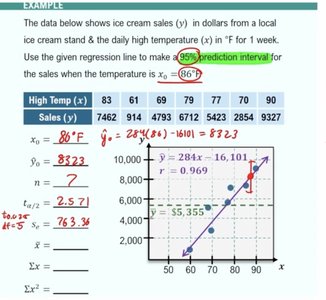
Worked Example: Ice Cream Sales
Given a regression equation for ice cream sales based on temperature, you can use the steps above to calculate a 95% prediction interval for sales at a specific temperature (e.g., 86°F).
Plug in the value to get the point estimate.
Calculate the margin of error using the formula below.
Find the interval for the predicted sales.
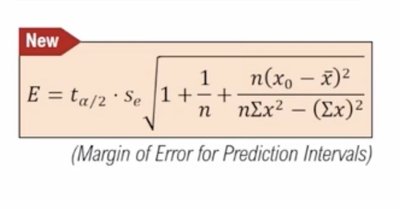
Margin of Error for Prediction Intervals
The margin of error for a prediction interval in regression is given by:
Calculating the Interval
After finding the margin of error, the prediction interval is:
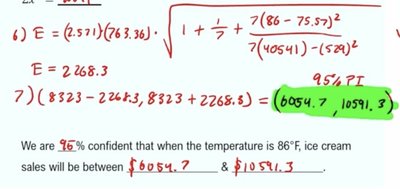
Interpretation
For example, if the prediction interval for ice cream sales at 86°F is (6054.7, 10591.3), we are 95% confident that the actual sales will fall within this range.
Summary Table: Steps for Constructing a Prediction Interval
Step | Description |
|---|---|
1 | Verify strong linear correlation and x-value within range |
2 | Calculate point estimate |
3 | Find critical value |
4 | Find standard error |
5 | Calculate sample statistics (, , ) |
6 | Compute margin of error |
7 | Find upper and lower bounds |
