 Back
BackSampling and Sampling Distributions: Concepts, Methods, and Applications
Study Guide - Smart Notes
 Tailored notes based on your materials, expanded with key definitions, examples, and context.
Sampling and Sampling Distributions
Introduction to Sampling
Sampling is the process of selecting a subset (sample) from a larger group (population) to make inferences about the population. In business statistics, sampling is essential because studying the entire population is often impractical due to cost, time, or physical constraints.
Population: The entire group of interest (e.g., all customers, all manufactured items).
Sample: A subset of the population selected for analysis.
Population Parameters: True values describing the population (e.g., mean μ, variance σ², proportion p).
Sample Statistics: Values calculated from the sample (e.g., sample mean \( \bar{x} \), sample variance s^2).
Why Sample?
Studying the entire population is often too expensive or time-consuming.
Some tests are destructive (e.g., crash-testing cars).
Sampling can provide timely and efficient information.
Properly selected samples can yield accurate estimates of population parameters with high certainty (e.g., 90%, 95%, 99%).
Sampling Methods
Sampling methods are classified into probability and non-probability techniques.
Probability Sampling Methods
Simple Random Sample: Every member of the population has an equal chance of being selected.
Systematic Random Sampling: Select every kth member from an ordered population, where k = N/n.
Stratified Random Sampling: Divide the population into mutually exclusive groups (strata) based on important variables, then randomly sample from each stratum.
Cluster Sampling: Divide the population into representative clusters (often geographically), then randomly select clusters to sample.
Non-Probability Sampling Methods
Do not involve random selection; may be biased and not representative of the population.
Examples: Convenience sampling, judgment sampling.
Not suitable for statistical inference.
Types of Error in Sampling
Sampling Error: Occurs by chance because only part of the population is examined. Reflected in the margin of error.
Non-Sampling Error: All other errors, including:
Coverage Error: Failing to include certain groups (selection bias).
No Response Error: Failure to collect data from all sampled items (non-response bias).
Measurement Error: Ambiguous questions, respondent bias, or errors in data collection.
The goal is to minimize non-sampling errors.
Sampling Distributions
Sampling Distribution of the Mean
The sampling distribution of the sample mean is the probability distribution of all possible sample means of a given size drawn from a population.
Sample means vary from sample to sample.
The distribution of these means is called the sampling distribution of the mean.
Key properties:
Mean: Equal to the population mean μ.
Standard Error: Standard deviation of the sample means, given by:
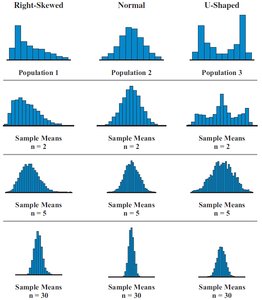
Shape: According to the Central Limit Theorem, the sampling distribution of the mean approaches a normal distribution as sample size increases (n > 30), regardless of the population's shape.
Example: Die Roll
All possible samples of size 2 are drawn from a six-sided die.
Sample means are calculated for each pair.
The frequency distribution of sample means shows how often each mean occurs and its probability.
Central Limit Theorem (CLT)
The CLT states that the sampling distribution of the mean of all possible samples of size n from any population will be approximately normal if n is sufficiently large (n > 30). If the population is normal, the sampling distribution is normal for any sample size.
As sample size increases, the standard error decreases, making the sample mean a more precise estimator of the population mean.
Finite Population Correction
When sampling without replacement from a finite population (n/N > 0.05), the standard error is adjusted using the finite population correction factor:
Standard Error:
Z-score (with finite population correction):
Sampling Distribution of the Proportion
Sampling concepts also apply to proportions (probabilities of an event occurring).
Population Proportion (p): True proportion in the population.
Sample Proportion (\( \hat{p} \)): Proportion in the sample, calculated as: where x is the number of items of interest in the sample, and n is the sample size.
Mean of Sample Proportions: Equal to p.
Standard Error:
Shape: The sampling distribution of the proportion is approximately normal if np > 5 and nq > 5 (where q = 1 - p).
Z-score for Proportions:
Finite Population Correction (for proportions): Standard Error: Z-score:
Summary Table: Key Formulas
Concept | Formula | Description |
|---|---|---|
Sample Mean | Average of sample values | |
Standard Error (Mean) | Standard deviation of sample means | |
Standard Error (Mean, Finite Population) | Adjusted for finite population | |
Sample Proportion | Proportion of interest in sample | |
Standard Error (Proportion) | Standard deviation of sample proportions | |
Standard Error (Proportion, Finite Population) | Adjusted for finite population | |
Z-score (Mean) | Standardized sample mean | |
Z-score (Proportion) | Standardized sample proportion |
Additional info: The image included visually demonstrates the Central Limit Theorem by showing how the distribution of sample means becomes more normal as sample size increases, regardless of the original population's shape.
